Breakout Trading Strategy PDF.I still remember the night I lost almost 40% of my account chasing a “breakout” on GBPUSD at 2 AM. Price broke a clean resistance line, I jumped in with a full lot, and within twelve minutes it reversed so hard I just sat there staring at my screen. No PDF, no strategy, just pure excitement.
That was seven years ago. Since then I’ve traded breakouts on forex pairs, crypto on Binance, and even index CFDs, and I’ve made almost every mistake a person can make with this style of trading. I’ve also figured out what actually works, and what most breakout trading strategy pdf guides floating around the internet completely leave out.
If you searched for a breakout trading strategy pdf hoping for a simple, honest answer instead of another recycled ebook, you’re in the right place. I’m going to walk you through exactly how I trade breakouts today, why so many breakouts fail, and how you can build your own downloadable checklist instead of trusting a random PDF from a website you’ve never heard of.
Key Takeaways
- A breakout trading strategy works best when you confirm volume and momentum, not just a broken price line
- Most retail traders lose money on breakouts because of false breakouts and poor timing, not because the concept is wrong
- Combining breakout entries with support/resistance, volatility tools like ATR, and a proper risk-reward ratio massively improves results
- A generic breakout trading strategy pdf downloaded online is no substitute for building your own tested rules on TradingView or MetaTrader
- Risk management and patience matter more than the entry trigger itself
What Breakout Trading Actually Means (In Plain Language)
Breakout trading means you wait for price to move past a key level — support, resistance, a trendline, or a chart pattern boundary — and you enter in the direction of that move. The idea is simple. Price has been trapped in a range or consolidation, and once it escapes that zone, it often keeps moving because new buyers or sellers jump in.
Sounds easy, right? It isn’t, and I learned that the hard way.
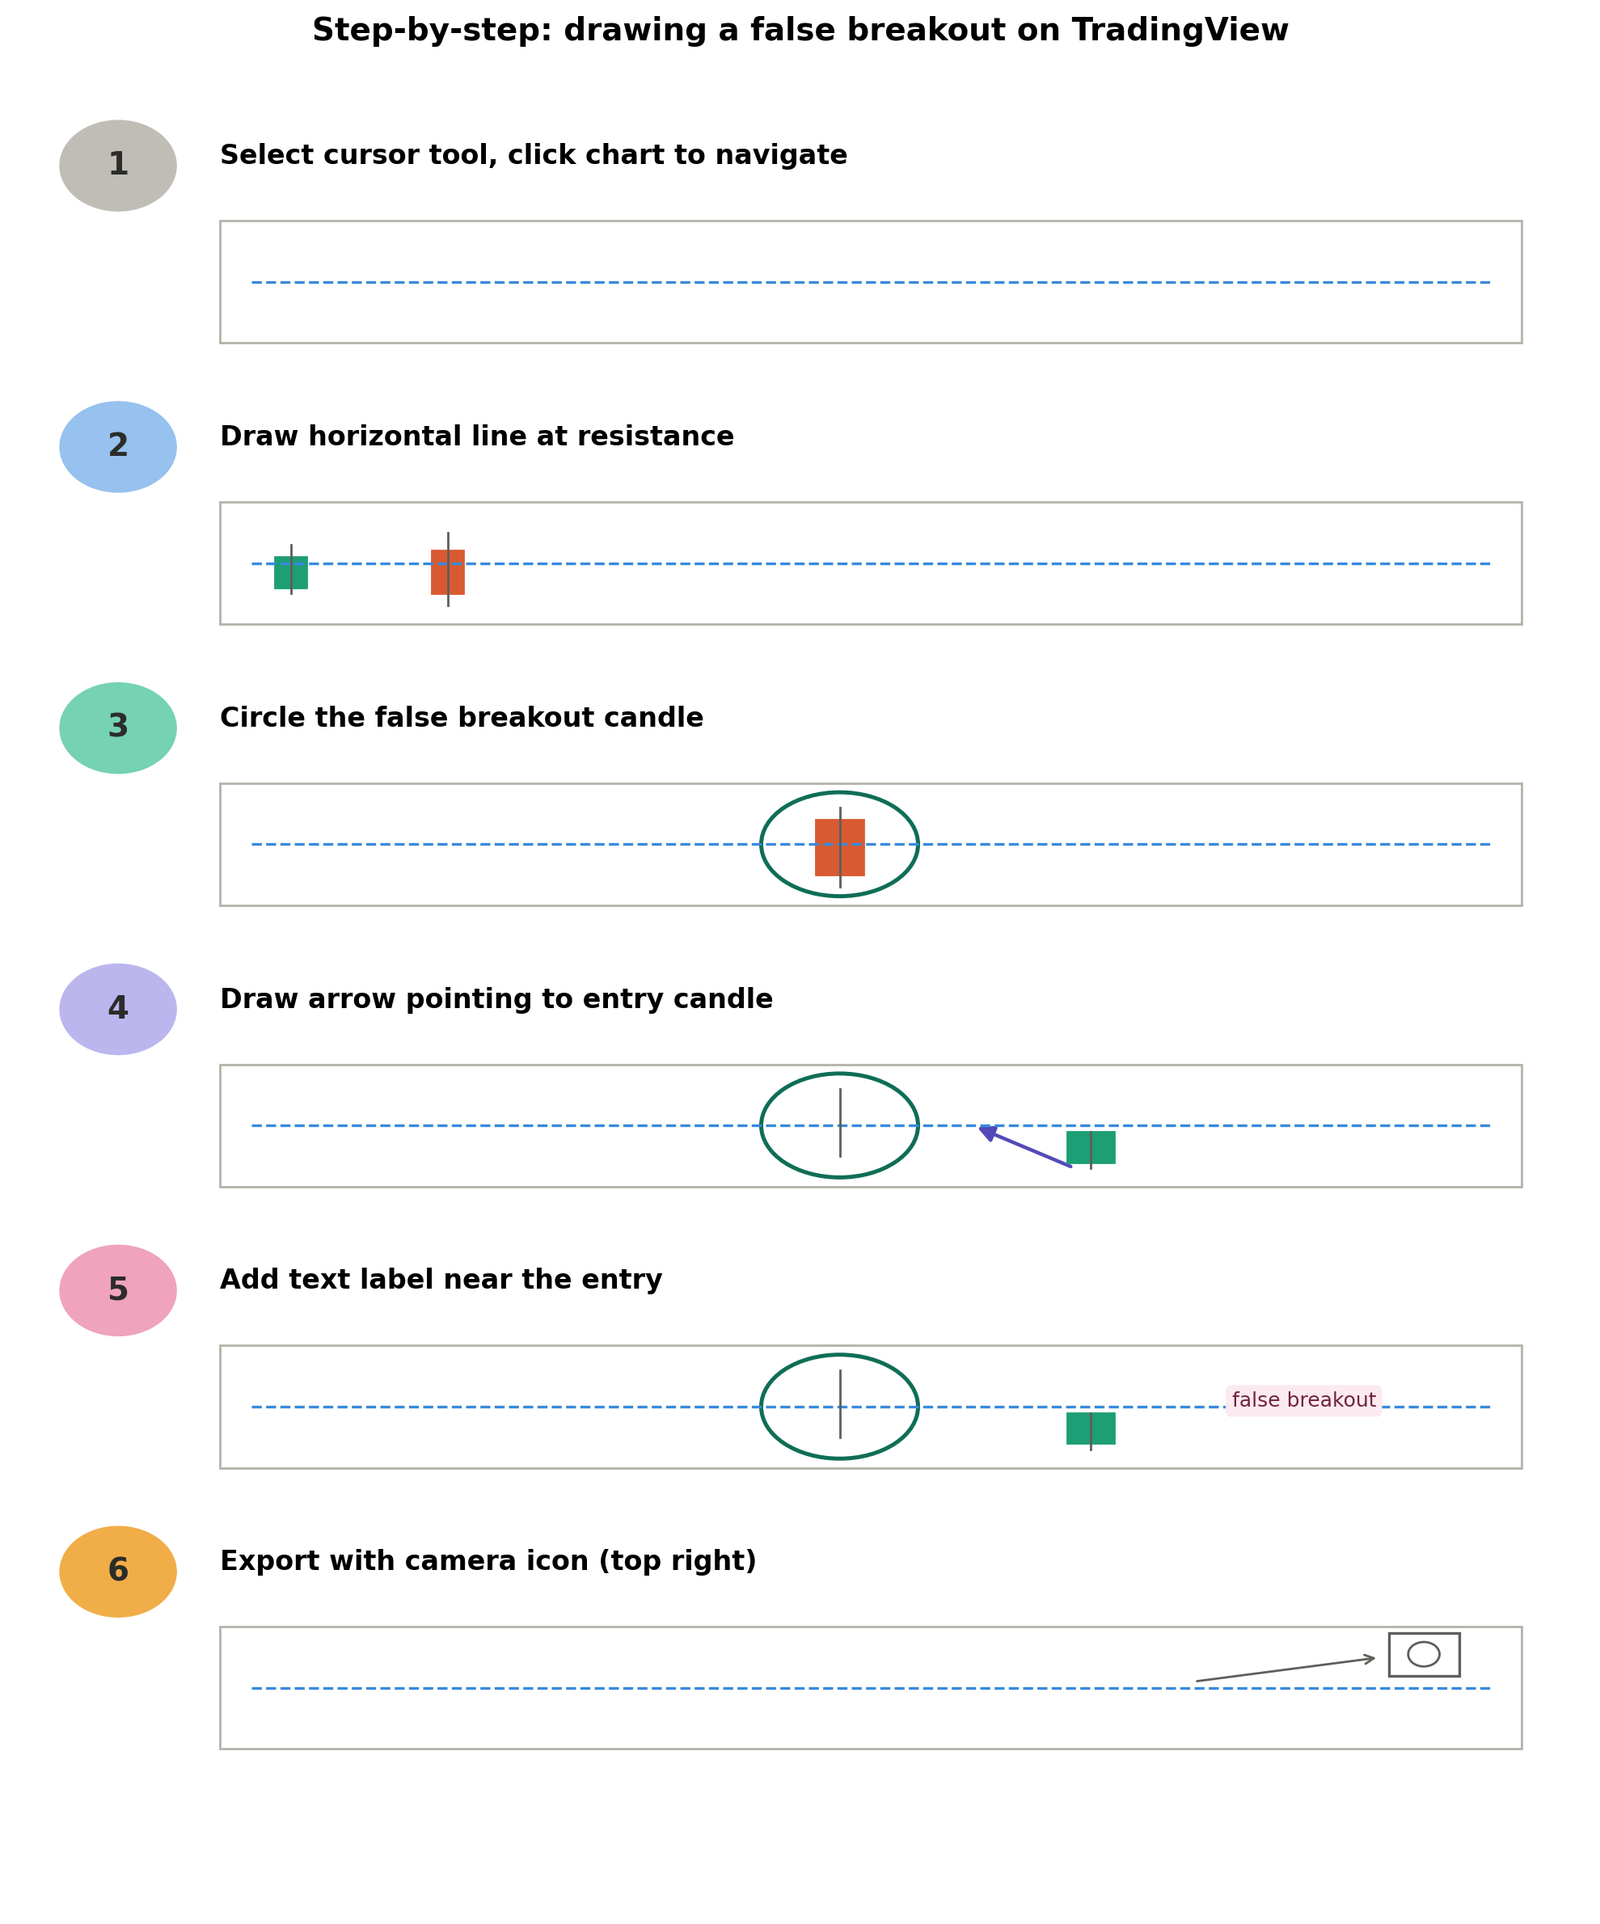
The problem is that price doesn’t always “keep moving” after a breakout. Sometimes it breaks out, traps everyone who entered, and snaps right back into the range. Traders call this a false breakout or a fakeout, and honestly, in my experience, fakeouts happen almost as often as real breakouts, especially on lower timeframes like the 5-minute or 15-minute chart.
That’s exactly why a proper strategy matters more than just spotting a line on a chart. Because anyone can draw a horizontal line at a swing high. Very few people know when that broken line actually means something.
Over time I noticed something interesting. Breakouts on higher timeframes, like the daily or weekly chart, tend to hold far better than breakouts on the 5-minute chart. That’s because bigger timeframes filter out random noise created by algorithmic trading bots and short-term scalpers. It doesn’t mean lower timeframe breakouts never work, it just means you need extra confirmation before trusting them.
Why I Stopped Trusting Random Breakout Trading Strategy PDFs
Early in my trading journey, I downloaded probably fifteen different breakout trading strategy pdf files from forums, Telegram groups, and random blogs. Almost all of them said the same three things: draw support and resistance, wait for a candle close outside the range, enter with a stop loss below the level.
That’s not wrong. But it’s incomplete, and it doesn’t tell you what happens when the market is choppy versus trending, or how to filter out weak breakouts from strong ones.
I remember one PDF that promised an “80% win rate breakout system.” I tested it manually on 100 trades using TradingView’s replay feature. My actual win rate came out around 42%. The strategy wasn’t fake — the marketing around it was misleading. No breakout strategy hits 80% consistently in real market conditions, and if someone tells you that, be careful.
Another thing those PDFs never mention is spread and slippage. On MetaTrader, especially during news events, spreads widen a lot. A breakout that looks perfect on paper can turn into a losing trade simply because your entry got filled at a worse price than expected. This alone caught me off guard more times than I’d like to admit during my first two years of trading.
This is why I eventually built my own checklist instead of relying on someone else’s PDF. I’ll share that exact checklist with you further down, and you can literally screenshot it or paste it into a document to make your own personal reference guide.
The Core Ingredients Of A Breakout That Actually Works
After years of screen time, here’s what I look for before I trust a breakout enough to risk real money.
Clear consolidation first. Price needs to have been ranging or consolidating for a while before the breakout. A random spike from a trending move isn’t the same thing as a proper breakout setup. Generally, the longer and tighter the consolidation, the stronger the eventual breakout tends to be.
Volume confirmation. On platforms like TradingView, I always check the volume indicator. A breakout candle with weak volume is a red flag. Real breakouts usually come with a noticeable spike in volume compared to the average, sometimes double or triple the recent bars.
Candle close, not wick. I never enter just because a wick poked outside the level. I wait for the candle to actually close beyond the support or resistance zone. This alone cut my false breakout entries by a huge margin.
Retest behavior. Sometimes price breaks out, comes back to retest the broken level, and then continues. This retest entry is often safer than jumping in on the initial breakout candle because you get a better price and clearer confirmation.
Market context. A breakout during a major news event on Forex Factory’s calendar, like NFP or an interest rate decision, behaves very differently than a breakout during a quiet Tuesday afternoon. I always check the calendar before trading any breakout.
Volatility measurement. I also glance at the ATR (Average True Range) indicator before placing my stop loss. If ATR is unusually high, I widen my stop a little so normal volatility doesn’t stop me out prematurely.
Common Breakout Chart Patterns Worth Knowing
Breakouts don’t only happen from horizontal support and resistance. Certain chart patterns tend to produce cleaner, more reliable breakouts, and it helps to recognize them quickly.
Rectangle or range breakout. This is the simplest one, price bounces between two horizontal levels for a while before breaking one side. I look for at least three touches on each side before I consider the range valid.
Triangle breakout. Ascending, descending, or symmetrical triangles form when price makes tighter and tighter swings. Volume usually dries up inside the triangle and then spikes on the actual breakout candle.
Flag and pennant breakout. These form after a strong directional move, when price pauses and consolidates briefly before continuing in the same direction. I’ve had good results trading flag breakouts on trending pairs like USDJPY during a strong dollar trend.
Double top or double bottom breakout. These patterns break the neckline after two failed attempts to push through a level, and often signal a bigger reversal once the neckline gives way.
Each of these patterns follows the same basic breakout logic, wait for the close, confirm with volume, then decide your entry style.
Pros and Cons of Breakout Trading Strategy
Pros
- Works across markets — forex, crypto, indices, stocks, so you’re not limited to one asset class
- Can catch big directional moves early, giving you a strong risk-reward ratio if the breakout is genuine
- Simple concept to understand for beginners compared to complex indicator-based systems
- Fits well with price action trading, so you don’t need dozens of indicators cluttering your chart
Cons
- False breakouts are common, especially in ranging or low-liquidity markets
- Requires patience — you can wait hours or days for a valid setup, which frustrates impatient traders
- Emotionally difficult because entries often happen right when price looks scary to buy or sell into
- Needs strict stop loss discipline, or one bad fakeout can wipe out several winning trades
Step-by-Step Breakout Trading Process I Actually Use
Here’s the exact process, step by step, the way I run it on my own charts every week.
Step 1: Mark the range. Open your chart on TradingView or MetaTrader 4/5. Identify a clear consolidation zone that’s lasted at least 15-20 candles on your chosen timeframe. I usually work on the 1-hour or 4-hour chart for forex.
Step 2: Draw your levels. Mark horizontal support and resistance, or draw a trendline if the range is sloped. Keep it simple — don’t overcomplicate with ten different lines.
Step 3: Wait for the close. Don’t enter on the wick. Wait for a full candle close beyond your marked level. On a 4-hour chart, this means waiting for that candle to fully finish.
Step 4: Check volume and momentum. Look at the volume bar under that breakout candle. Also check if RSI or MACD supports the move rather than showing divergence.
Step 5: Decide entry type. Either enter right after the confirmed close, or wait for a retest of the broken level. I personally prefer the retest entry about 70% of the time because it gives a tighter stop loss.
Step 6: Set stop loss and target. Place your stop loss just beyond the other side of the broken level. Aim for at least a 1:2 risk-reward ratio, meaning if you risk 20 pips, target at least 40 pips.
Step 7: Manage the trade. Once price moves in your favor by the amount you risked, move your stop loss to breakeven. This protects you from turning a winner into a loser if momentum fades.
Step 8: Journal it. Write down the setup, outcome, and what you’d do differently. I use a simple Google Sheet, but Notion works fine too.
Step 9: Review weekly. Every Sunday, I go back through my journal and check which setups actually worked. This weekly review is honestly what improved my results the most over the years, far more than any single indicator ever did.
Risk Management Rules I Never Break
A breakout strategy without proper risk management is just gambling with extra steps. Here’s what I personally stick to on every single trade.
I never risk more than 1-2% of my account on a single breakout trade. This means even a string of five or six losing trades in a row won’t seriously damage my account. Because I know from experience that losing streaks do happen, even with a solid strategy.
I also avoid trading more than three breakout setups in a single week unless the market is unusually active. Overtrading breakouts was one of my earliest and costliest habits, and cutting this down forced me to only take my best setups.
Position sizing matters too. I calculate lot size based on my stop loss distance in pips and my account risk percentage, rather than using a fixed lot size every time. Most brokers and platforms, including MetaTrader, have a built-in calculator, or you can use a free position size calculator online.
Mistakes To Avoid (Learned The Expensive Way)
Entering on the wick instead of the close. This was my biggest early mistake. I’d see a long wick poke through resistance and jump in immediately, only to watch price close right back inside the range.
Ignoring the higher timeframe trend. I once shorted a breakout on the 15-minute chart while completely ignoring that the daily chart was in a strong uptrend. The breakout failed almost instantly because it was fighting the bigger trend.
Trading every single breakout. Not every broken level deserves a trade. Early on I overtraded, taking five or six breakout setups a day. My win rate improved dramatically once I cut that down to one or two high-quality setups a week.
No stop loss, or stop loss too tight. Either extreme hurts you. I’ve placed stops so tight that normal market noise stopped me out right before the real move happened.
Trading breakouts right before major news. A breakout an hour before an interest rate announcement or NFP release is basically a coin flip. I always check Forex Factory before entering anything close to high-impact news time.
Revenge trading after a fakeout. After losing on a false breakout, I used to immediately jump into another trade to “win it back.” That mindset cost me more than the original loss ever did.
Ignoring correlation between pairs. I once took breakout trades on both EURUSD and GBPUSD at the same time, not realizing they were moving almost identically. When the trade went wrong, it hurt double instead of diversifying my risk.
Building Your Own Breakout Trading Strategy PDF
Instead of downloading someone else’s generic breakout trading strategy pdf, I’d honestly recommend building your own one-page checklist. Open a Google Doc or Word file, write down your five entry rules, your stop loss rule, your risk-reward target, and your no-trade conditions like major news events.
Print it, save it as a PDF, and keep it next to your trading screen. This personal document will serve you far better than any strategy you copy from a stranger online, because it reflects your own tested rules, your risk tolerance, and the specific markets you trade.
If you want to go deeper on this topic, it’s worth reading up separately on support and resistance trading, risk management position sizing, and candlestick patterns for confirmation — these three topics connect directly with breakout trading and round out a complete trading approach.
One Last Thought
Breakout trading isn’t about finding a magic PDF or a secret indicator. It’s about patience, waiting for the right conditions, and respecting your stop loss even when it hurts. I’ve been doing this for seven years, and the trades that worked best were never the exciting, adrenaline-filled ones. They were the boring, well-confirmed setups I almost didn’t take because they looked too obvious.
Frequently Asked Question
False breakout trading strategy PDF
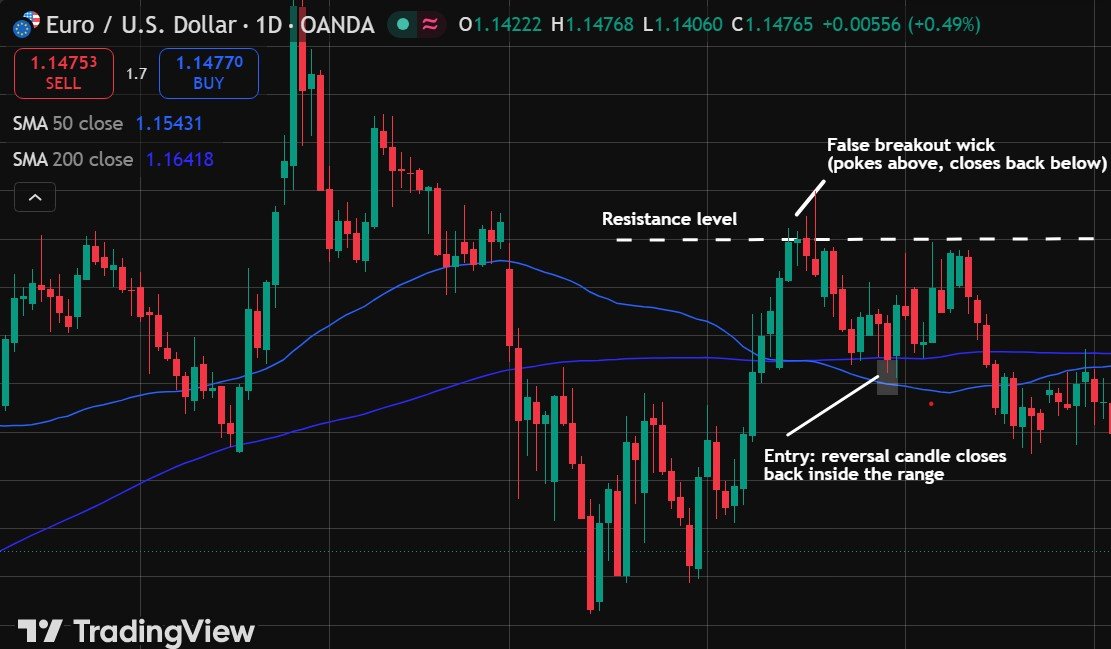
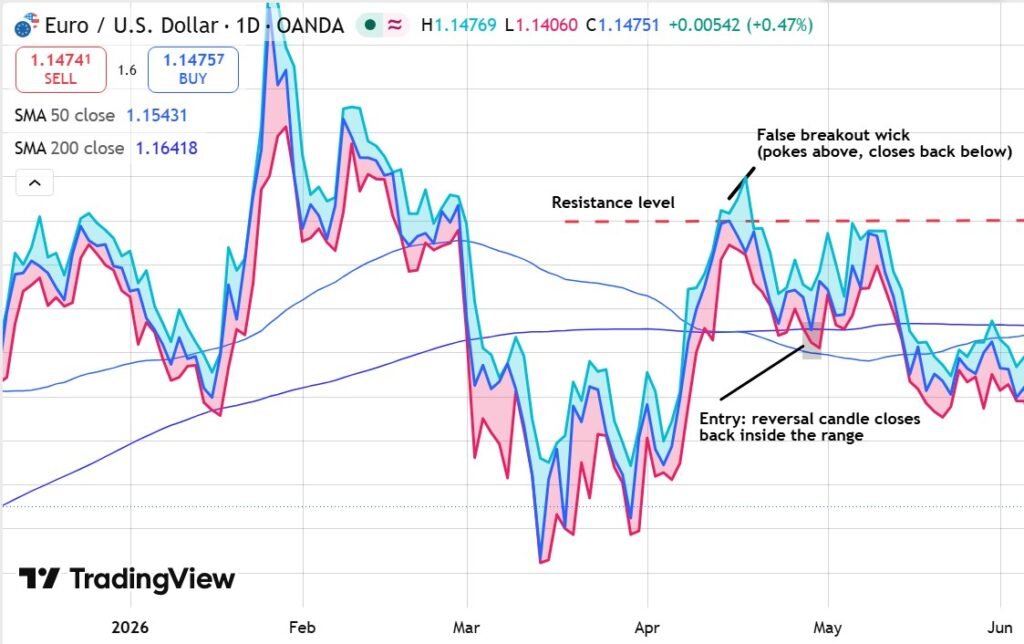
A false breakout strategy means entering a trade when price breaks a level but then reverses and traps traders who jumped in early. The entry is usually taken after a reversal candle closes back inside the range, in the opposite direction.
Price action breakout strategy PDF
A price action breakout strategy relies only on candle closes, support/resistance levels, and volume, without using extra indicators. It’s one of the simplest and cleanest approaches for beginner traders.
Breakout trading strategy win rate
Genuine breakout strategies usually have a win rate between 40-55%, and profitability comes from a strong risk-reward ratio rather than a high win rate. If any strategy claims an 80%+ win rate, be cautious.
The Breakout Trading Revolution PDF
This is a well-known trading ebook based on a former Wall Street floor trader’s experience, covering classic breakout patterns and momentum trading. The core concepts are solid, but should be combined with volume and news timing for modern markets.
Disclaimer:
This article is for educational purposes only and does not constitute financial advice. Trading forex, crypto, and other financial instruments carries substantial risk of loss.

Hira Ch is a Forex trader and financial content writer specializing in gold, crypto, and currency markets.Based in Lahore, she breaks down complex trading
concepts into simple, actionable insights at ExpertJourny.