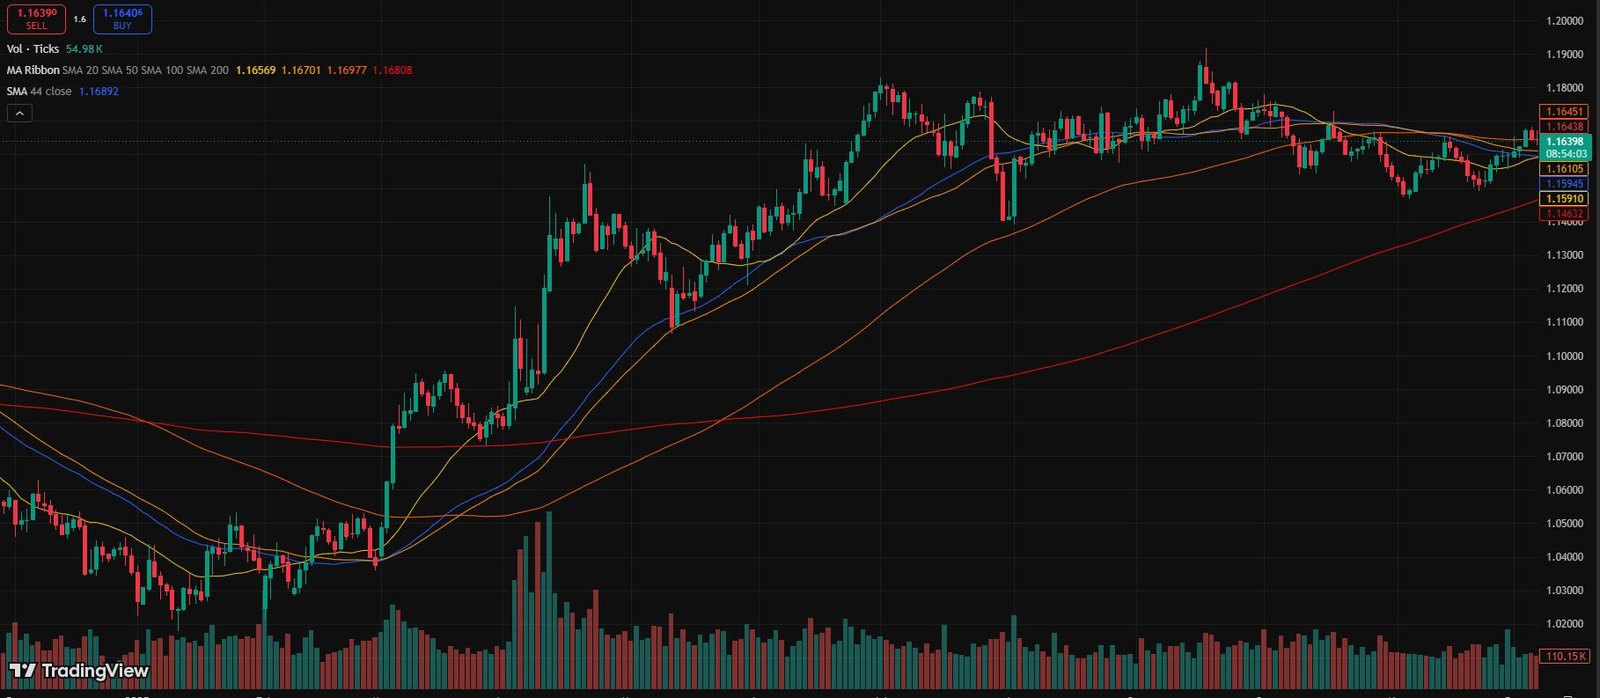
Schd Below 200- Day Moving Average.There’s a specific kind of anxiety that hits when you check your brokerage account in the morning and see a ticker you genuinely believed in sitting below a line you’d been watching for weeks. For me, that ticker was SCHD — the Schwab U.S. Dividend Equity ETF — and that line was the 200-day moving average.
This wasn’t panic selling territory. This was something more unsettling: the slow, grinding kind of market behavior that makes you question everything you thought you knew about “safe” dividend investing.
Let me tell you what actually happened, what I did wrong, what I did right, and what I’d tell someone staring at the same chart right now.
How I Got Into SCHD In the First Place
A few years back, I got tired of watching speculative positions eat my account alive. Crypto was doing what crypto does. A few small-cap tech bets had gone sideways. I wanted something boring — something that paid me while I waited.
SCHD kept coming up. Quality dividend stocks, low expense ratio (0.06% — genuinely hard to beat), quarterly payouts, and a track record that made long-term holders look like geniuses. Morningstar gave it five stars. Every finance YouTuber seemed to own it. So I started a position.
For about eight months, life was good. Dividends hit every quarter. The price drifted higher. I added on dips.
Then the 200-day moving average became relevant in a way I hadn’t fully prepared for.
What the 200-Day Moving Average Actually Is (Without the Textbook Version)
Most explanations start with “it’s the average closing price over the last 200 trading days” — which is true but doesn’t tell you why it matters.
Here’s how I think about it: the 200 DMA is basically a slow-moving pulse check on a stock or ETF. It smooths out all the daily noise — the Fed minutes, the earnings surprises, the random Tuesday selloffs — and shows you the underlying trend.
When price is above the 200 DMA, the market’s general posture toward that asset is positive. Money is flowing in over the long term. When price breaks below it, something structural may be shifting.
“May be” is doing a lot of work in that sentence. And that’s the part most people gloss over.
The 200 DMA is not a crystal ball. It’s a reference point. A line in the sand that a lot of institutional money watches. And because a lot of big players watch it, it can become a self-fulfilling signal in both directions — which is exactly what makes it worth understanding.
The Morning SCHD Crossed Below the Line
I was using Thinkorswim at the time — TD Ameritrade’s platform, now rolled into Schwab — and I had SCHD on my watchlist alongside a simple chart with the 200 DMA overlaid. Nothing fancy. Just price and that one line.
When SCHD closed below the 200 DMA for the first time during the broader market weakness, my first reaction was to check if I’d set it up correctly. Surely this was a data glitch. SCHD was supposed to be the boring, reliable one.
It wasn’t a glitch.
Over the following weeks, SCHD continued to trade below that level. Every little rally would bring it back near the line, but it kept getting rejected. For anyone who watches charts, you know what that pattern feels like — like a boxer getting knocked down and just barely making it to their feet before the count ends, but never quite getting back in the fight.
What the Chart Was Actually Telling Me
Here’s what I’ve come to understand, after getting it wrong more than once: SCHD dropping below the 200 DMA doesn’t mean the ETF is broken. It means the market environment that made SCHD attractive — stable growth, rate certainty, appetite for dividend income — had shifted.
SCHD is heavily weighted toward financials, industrials, and consumer staples. When interest rates are rising aggressively, those sectors face real headwinds. Dividend stocks in particular get hit because higher risk-free rates (like Treasury yields) make the dividend yield on an ETF look less attractive by comparison. Why take the volatility of equities for a 3.5% yield when a 6-month T-bill is paying close to that with zero market risk?
That rotation out of dividend equities is exactly what the 200 DMA breach was reflecting. Not SCHD’s fault. Not poor stock selection within the fund. Just macro forces playing out through the price.
Understanding that distinction saved me from making the most common mistake people make when they see this pattern.
The Mistake I Almost Made — And What Stopped Me
The instinct, when you see an ETF you trust drop below a key technical level, is binary: either panic sell because “the trend is broken,” or aggressively add because “it’s on sale.”
Both of those reactions, executed without more context, are dangerous.
I almost added aggressively at the first dip below the 200 DMA. My logic was straightforward: SCHD has never gone to zero, the underlying companies are quality businesses, and the yield was now higher because the price had dropped. Textbook “buy the dip.”
What stopped me was a note I’d written to myself after reading a post-mortem on a trade gone wrong months earlier. It said: price below the 200 DMA is not automatically a buying opportunity — it’s a warning to slow down and ask why.
So instead of clicking buy, I spent a few days actually asking why. Why was SCHD selling off? Was it specific to dividend stocks? Was it broad market pressure? Was anything fundamentally different about the holdings?
The answers led me to a better decision than gut instinct would have.
What I Actually Did (Step by Step)
Pull up the sector breakdown.
SCHD’s top sectors at the time were financials and healthcare. Both were underperforming the broader market. This wasn’t random — it was thematic. Understanding this told me the selloff wasn’t company-specific drama; it was sector rotation.
Check the 200 DMA on the S&P 500.
If the broader market is also below its 200 DMA, adding to any equity position is a higher-risk move. If the market is holding above its 200 DMA and SCHD is below, that divergence is more interesting — potentially a buying opportunity.
At the time, the S&P was in its own technical trouble. That told me to keep powder dry rather than deploy aggressively.
Look at dividend yield vs. Treasury yields.
This is the context move that most retail traders skip. I pulled up the 10-year Treasury yield on TradingView alongside SCHD’s trailing yield. When the gap between the two narrows significantly, dividend ETFs lose their relative appeal. That was exactly the environment we were in.
Set a watchlist alert, not a buy order.
Instead of buying on the first cross below the 200 DMA, I set a price alert on Thinkorswim: notify me if SCHD closes back above the 200 DMA for two consecutive sessions. That would be my signal to reassess, not the initial breakdown.
Keep collecting the dividend.
This is the one thing I did right from the start without hesitation. Dividend payments continued throughout the drawdown. Reinvesting those dividends at lower prices quietly improved my cost basis without requiring me to make any emotional decisions.
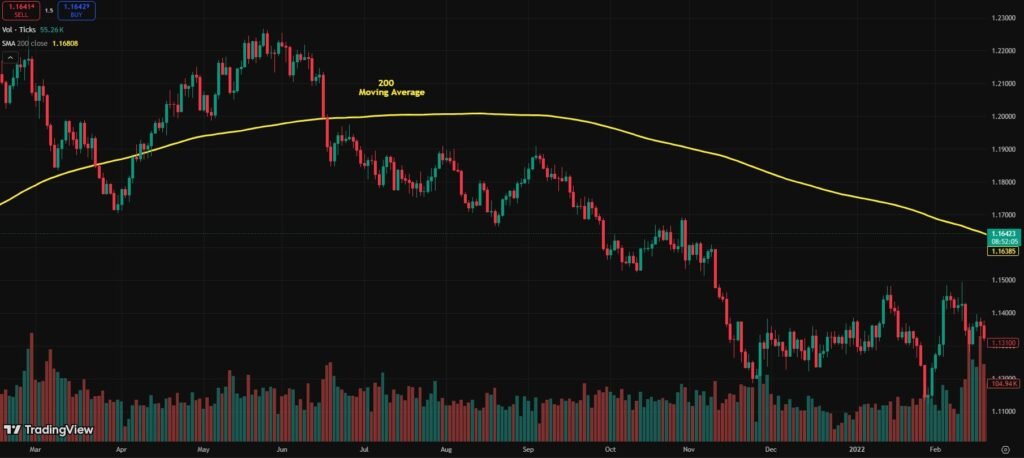
The Reality of Holding Through a 200 DMA Breakdown
Here’s what nobody talks about honestly: it’s uncomfortable. Even if you intellectually understand why SCHD is below the line, watching a position sit underwater for weeks or months tests your conviction in a way that paper analysis never does.
There were days I’d open the app, see the position down 8-10%, and feel genuinely stupid for not selling when I had the chance. Those feelings aren’t signs of weakness — they’re just the psychological tax you pay for being invested in anything that moves.
What helped me was zooming out. Pull up a 5-year SCHD chart. Every prior period where it traded below the 200 DMA looks small. The 2020 COVID crash. The 2022 rate shock. Each of those looked catastrophic in real time. On a longer chart, they’re barely visible dips in an otherwise upward trajectory.
That perspective doesn’t pay your bills this month. But it does stop you from making permanent decisions based on temporary situations.
What Happened Next — And the Part That Surprised Me
When SCHD eventually reclaimed the 200 DMA, it didn’t do it dramatically. There was no big gap up, no announcement, no moment where it suddenly felt “safe” again. It just quietly climbed back above the line over a few weeks, held it, and then started trending higher again.
The surprising part? My reinvested dividends during the drawdown meant I had more shares than when it started. My yield on cost had actually improved because I’d been adding (through DRIP — dividend reinvestment plan) at lower prices. The period that felt like a disaster ended up quietly improving my long-term position.
This is the part of the story that gets left out when people talk about technical analysis. The 200 DMA breakdown wasn’t a catastrophe. It was a test — of patience, of process, and of whether I actually understood what I owned.
When Breaking Below the 200 DMA IS a Serious Warning
To be fair to both sides of this: there are situations where a 200 DMA breakdown in an ETF or stock is genuinely telling you something is wrong, not just temporarily uncomfortable.
Watch out when:
Volume is significantly higher than average during the breakdown. Heavy selling on elevated volume suggests institutions are genuinely exiting, not just rebalancing. You can check this on any free platform — TradingView, Yahoo Finance, even the Schwab app shows volume bars.
The fundamental story has changed. If SCHD’s top holdings started cutting dividends, or if there was a sudden regulatory change affecting financials, a 200 DMA breach combined with deteriorating fundamentals is a much more serious signal.
The breakdown is part of a broader bear market in equities. A 200 DMA breakdown during a market-wide bear phase is different from a sector-specific pullback during a healthy broader market. Context is everything.
Multiple moving averages are stacking against the position. When the 50 DMA crosses below the 200 DMA — called a “death cross” in technical analysis — that’s a longer-term bearish signal worth taking seriously, not just a short-term wobble.
Tools That Actually Helped Me Through This
TradingView — free tier is genuinely useful for charting SCHD against its 200 DMA, overlaying sector ETFs, and comparing yields. The alerts feature is underrated.
Thinkorswim (Schwab) — for setting conditional alerts and running basic technical scans. If you’re already a Schwab customer, this is worth learning even at a basic level.
Simply Safe Dividends — specifically for checking whether the underlying holdings’ dividends were at risk during the drawdown. Paid service, but worth it if dividend income is your strategy.
DRIP (Dividend Reinvestment Plan) — not a tool exactly, but enabling automatic dividend reinvestment through your broker is the most underrated move for long-term holders during drawdowns. It removes the emotional decision of “should I reinvest this quarter’s payment?”
Stockanalysis.net — free site that shows SCHD’s holdings, sector weights, and historical performance without needing to sign up for anything.
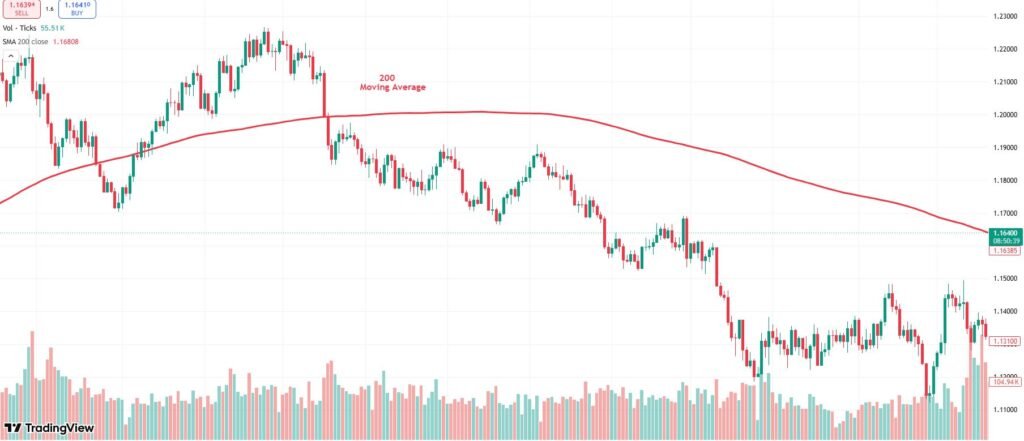
Mistakes to Avoid If You’re Watching SCHD Below the 200 DMA Right Now
Don’t treat the 200 DMA as a hard buy or sell signal by itself. It’s one data point. Use it alongside fundamentals, macro context, and your own time horizon.
Don’t check your account every hour. Seriously. It makes drawdowns feel worse than they are and leads to emotional decisions. Set alerts, then close the app.
Don’t compare SCHD’s performance to growth ETFs during a risk-on environment. SCHD is built for income and stability. Comparing it to QQQ or ARKK during a bull run is like complaining your pickup truck doesn’t handle like a sports car. Different tool, different purpose.
Don’t ignore the macro context. Where are interest rates? What are Treasury yields doing? Is the broader market above or below its own 200 DMA? These questions matter more than the SCHD chart in isolation.
Don’t let paper losses make you abandon a strategy that was sound when you started. If you bought SCHD for dividend income and long-term growth, a temporary breach of the 200 DMA doesn’t change that thesis unless the fundamentals have actually changed.
A Note on Using the 200 DMA as an Entry Signal
Some traders use the 200 DMA as a systematic entry trigger: only buy when price is above the line, exit when it falls below. This works for certain trading styles — particularly trend-following approaches.
For long-term dividend investors, this mechanical approach doesn’t always make sense. SCHD’s value comes from compounding dividends over time. Constantly entering and exiting based on a technical indicator can mean paying taxes on gains, missing dividend payments, and whipsawing in and out of positions at exactly the wrong moments.
A more useful approach for dividend investors: use the 200 DMA as a context tool, not a trigger. Ask what it’s telling you about the current environment. Adjust your position sizing accordingly. But don’t let one technical indicator override a long-term strategy that’s working.
Final Thoughts
The 200-day moving average is one of the most watched lines in all of investing. Trillions of dollars in institutional money pays attention to it. When a solid, well-constructed ETF like SCHD drops below it, the instinct is to either panic or dismiss it entirely.
Neither extreme serves you well.
What actually serves you is slowing down, understanding why it happened, checking whether the fundamental case for the investment has changed, and making a deliberate decision rather than an emotional one.
My SCHD position below the 200 DMA taught me more about my own investing behavior than almost any winning trade ever has. The winners feel good but teach you little. The uncomfortable periods — when your conviction gets tested by a chart that looks wrong — that’s where you actually figure out whether you have a strategy or just a hope.
SCHD recovered. It tends to. The 200 DMA line is somewhere below the current price now, acting as support instead of resistance.
But the lesson isn’t “SCHD always comes back.” The lesson is: know what you own, understand why the chart is doing what it’s doing, and have enough process in place that a red line on a chart doesn’t make you do something you’ll regret six months later.
Frequently Asked Questions
Should you buy a stock below its 200-day moving average?
Not automatically — it depends on why it’s below the line. If fundamentals are still strong and it’s just macro pressure, it can be a buying opportunity; if the business itself is deteriorating, it’s a warning to stay away.
What did Charlie Munger say about the 200-day moving average?
Munger was openly dismissive of technical indicators like the 200 DMA — he believed buying great businesses at fair prices mattered far more than any line on a chart. He once called most technical analysis “astrology with numbers.”
What stocks are below the 200-day moving average?
This changes daily — you can check a real-time screener on Finviz.com or TradingView by filtering “Price below 200 DMA” to see the current list across any sector or market cap.
What if a stock is below the 200 DMA?
It simply means the stock is in a medium-to-long term downtrend based on price alone — your next step is to ask why, check the fundamentals, and decide if the reason is temporary or structural.

Hira Ch is a Forex trader and financial content writer specializing in gold, crypto, and currency markets.Based in Lahore, she breaks down complex trading
concepts into simple, actionable insights at ExpertJourny.