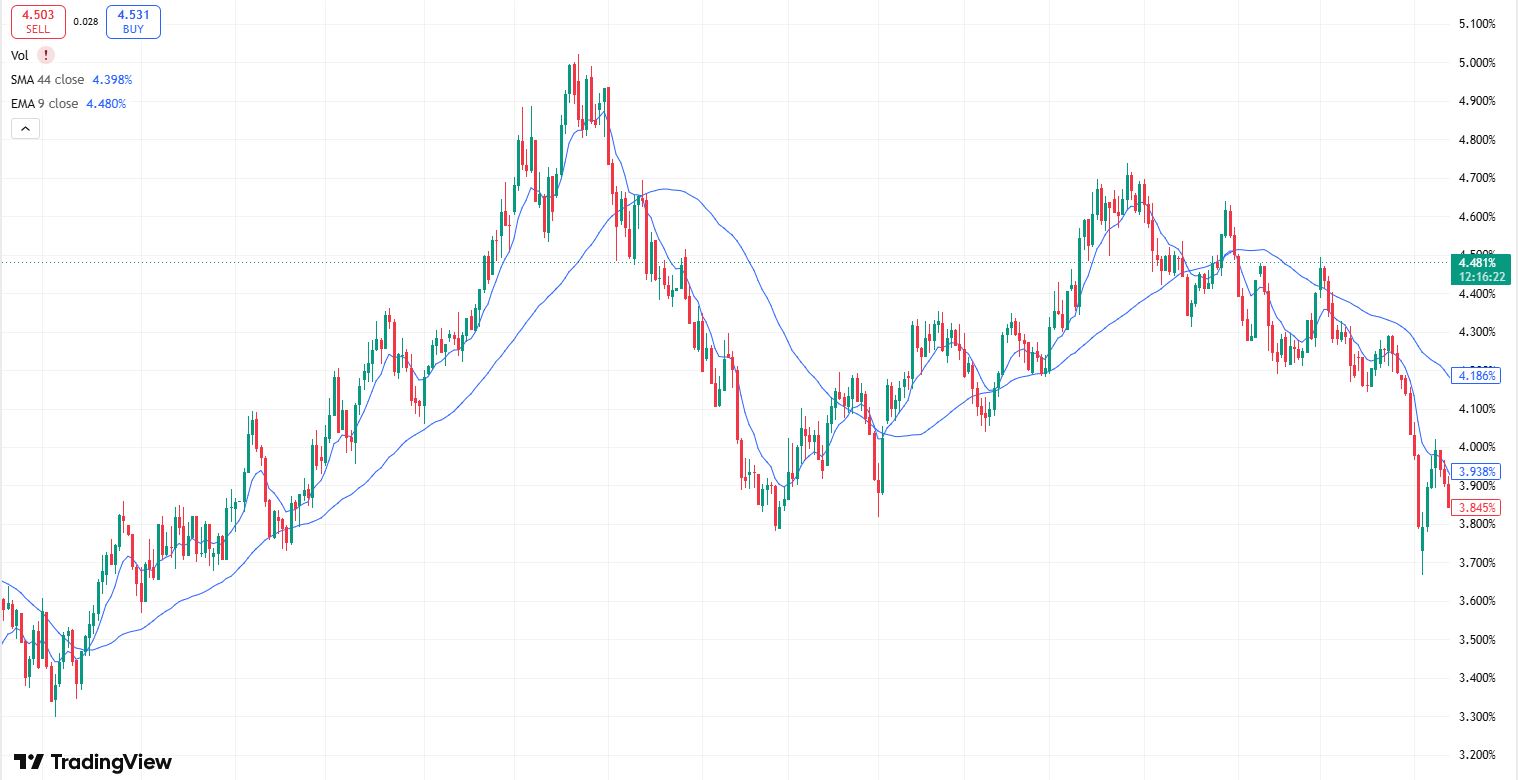
ewma-exponentially-moving-everage.For the longest time, I had a lag problem.
Not the internet kind. The chart kind.
I was using a simple 50-period moving average on my EUR/USD trades. It worked — sort of. It told me the trend direction. But by the time it signaled something useful, price had already moved. I’d enter, ride a tiny bit of the move, then watch it reverse while my moving average was still pointing the wrong way.
It was like getting weather updates three days late. Technically accurate. Completely useless.
A friend who traded commodity futures mentioned something called EWMA — Exponentially Weighted Moving Average. He said it solved exactly the problem I was describing. Same concept as a regular moving average, but it weighs recent price data more heavily than older data.
I thought he was describing the EMA — Exponential Moving Average — which I’d used before.
He shook his head. “EMA and EWMA are related but not the same. EWMA is more precise. It’s what risk managers at banks actually use.”
That last sentence got my attention.
I spent the next two weeks learning everything about it. And what I found genuinely improved how I read momentum, manage risk, and time entries.
What EWMA Actually Is — Simply Explained
Let me explain this the way I wish someone had explained it to me.
A simple moving average (SMA) treats every data point equally. If you have a 10-period SMA, it adds up the last 10 closing prices and divides by 10. Every price from 10 days ago carries the same weight as yesterday’s price.
That’s the problem. In fast-moving markets, what happened 10 days ago is largely irrelevant compared to what happened yesterday. But SMA doesn’t know that.
An Exponential Moving Average (EMA) fixes this partially — it gives more weight to recent prices. But the way it decays that weight over older periods is somewhat arbitrary depending on the period you choose.
EWMA — Exponentially Weighted Moving Average — takes this further with a specific smoothing parameter called lambda (λ). This parameter controls exactly how quickly the weight given to older data decays.
A lambda close to 1 (like 0.97) means older data still carries significant weight — the average moves slowly and smoothly. A lambda closer to 0 (like 0.85) means recent data dominates — the average reacts faster but can be choppier.
The most famous application of EWMA is in risk management — specifically in calculating volatility. JP Morgan’s RiskMetrics model, which became an industry standard in the 1990s, used EWMA with a lambda of 0.94 for daily data to estimate portfolio volatility.
That’s what my friend meant when he said banks use it. It’s not just a chart indicator. It’s a volatility measurement tool that happens to be extremely useful for traders too.
Why This Matters for Actual Trading
Here’s where it gets practical.
Most retail traders think about moving averages only as trend-following tools — is price above or below the line? But EWMA opens up a second application: measuring how volatile the market currently is and adjusting your trading accordingly.
When EWMA volatility is rising, the market is becoming more unpredictable. Spreads widen. Stop losses get triggered more easily. Breakouts are more likely to be genuine but also more likely to reverse violently.
When EWMA volatility is low and contracting, the market is coiling. Often a precursor to a big move. Or a period where range trading works better than trend following.
Understanding this changed two things about how I trade:
First, I stopped using fixed stop losses. Instead of always placing a 20-pip stop, I started sizing my stop based on current EWMA volatility. High volatility = wider stop, smaller position. Low volatility = tighter stop, larger position.
Second, I started using EWMA as a trend filter differently. Not just “is price above the EWMA line” — but “is the EWMA slope steepening or flattening, and is volatility expanding or contracting in that direction?”
Those two questions together give you a much richer picture of what the market is doing than any basic moving average crossover.
EWMA vs EMA — What’s Actually Different
Both give more weight to recent data. Both react faster than SMA. Both are useful for trend identification. So what’s the real difference?
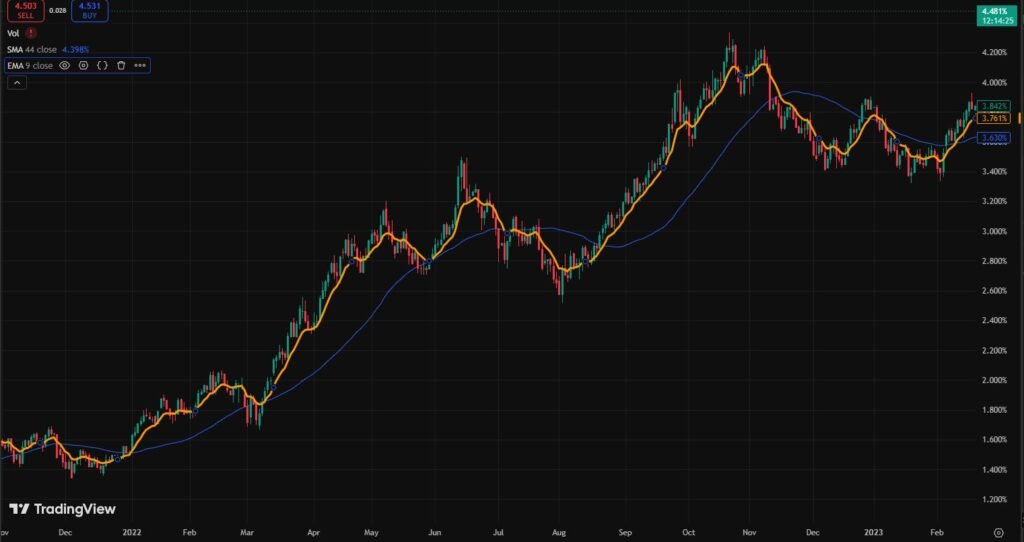
Calculation method. EMA uses a fixed multiplier based on the period: Multiplier = 2 ÷ (Period + 1). For a 20-period EMA, the multiplier is 2 ÷ 21 = 0.0952. EWMA lets you set lambda directly — giving you precise control over how fast the average responds.
Use in volatility calculation. EMA is primarily a price-smoothing tool. EWMA is also used to calculate rolling volatility — applying the same exponential weighting logic to squared returns rather than just price levels. This is the application that risk managers use.
Flexibility. In practice, a 20-period EMA and an EWMA with lambda = 0.905 will give you nearly identical results on a price chart. The real advantage of EWMA shows up when you’re calculating volatility or building a more systematic approach to position sizing.
How I Use EWMA in My Trading — Practically
For trend identification:
On TradingView, I use two EWMAs — a faster one (lambda 0.90, roughly 19-period EMA) and a slower one (lambda 0.97, roughly 65-period EMA). When the faster is above the slower and both are sloping upward, I’m looking for long entries only. When the faster crosses below the slower, I start watching for shorts.
This isn’t a crossover system — I don’t blindly enter on the cross. The cross just tells me which direction I should be biased.
For volatility measurement:
I calculate a simple EWMA of the daily range (high minus low) using a spreadsheet. Every evening, I note the day’s range, apply the EWMA formula with lambda = 0.94, and track the resulting volatility estimate.
When current daily range is significantly above the EWMA of range, volatility is elevated. I widen stops by 30-40% and reduce position size proportionally.
When current daily range is below the EWMA of range, volatility is compressed. I tighten stops and can consider slightly larger positions.
The formula:
EWMA(t) = λ × EWMA(t-1) + (1 – λ) × Value(t)
Start with the first few values as a simple average to initialize, then apply the formula forward.
A Real Trade Where EWMA Volatility Changed My Decision
About seven months ago — GBP/JPY.
I had a bullish order block setup on the 4-hour chart. Price had swept a liquidity level and was showing reversal signs. Normal conditions, I would have entered with a 35-pip stop.
But I checked my EWMA volatility tracker. The 5-day EWMA of daily range on GBP/JPY was sitting at 142 pips — significantly above the 20-day EWMA of 118 pips. Volatility was elevated by about 20%.
So I adjusted: widened my stop to 50 pips, reduced position size by 30% to keep dollar risk the same.
Price moved 38 pips against me before reversing. With my normal 35-pip stop, I would have been stopped out. With the volatility-adjusted 50-pip stop, I stayed in.
GBP/JPY ran 140 pips in my direction over the following three days.
Without the EWMA volatility adjustment, that trade would have been a loss. With it, it was one of the better trades of that month.
Setting Up EWMA on TradingView
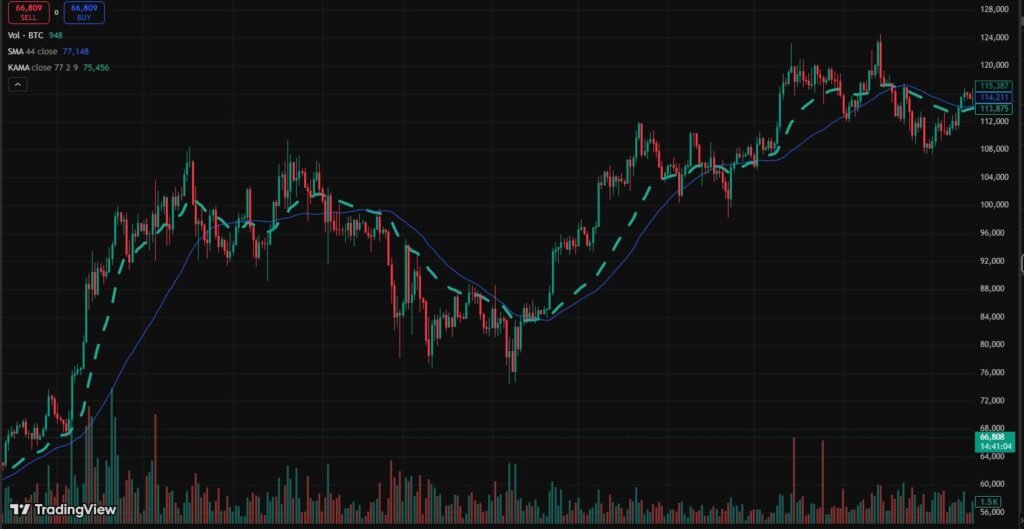
TradingView doesn’t have a built-in “EWMA” indicator — but since EMA and EWMA are mathematically equivalent when you match the lambda to the period, use TradingView’s EMA with these settings:
To match a specific lambda: Period = (2 ÷ (1 – λ)) – 1
- Lambda 0.90 → Period ≈ 19
- Lambda 0.94 → Period ≈ 32
- Lambda 0.97 → Period ≈ 65
For the volatility spreadsheet in Google Sheets, three columns: Date, Daily Range, EWMA. Formula:
=(0.94 * previous EWMA cell) + (0.06 * current range cell)
Update it each evening. Takes 30 seconds per pair.
Mistakes I Made Learning EWMA
Treating it as a magic indicator. I overcomplicated it early on — adjusting position sizes on every tiny volatility fluctuation. Only make meaningful adjustments when volatility is 15-20% above or below average. Smaller deviations are just noise.
Using too short a lambda. I tried lambda = 0.80 wanting maximum responsiveness. The result moved so fast it was almost useless. Lambda between 0.90 and 0.97 is the practical range for most trading.
Ignoring it during low volatility periods. EWMA volatility is most useful when it’s changing significantly. During flat, extended low-volatility periods the signal adds little value.
Applying it to the wrong timeframe. EWMA volatility from daily data gives daily context. If you’re trading 15-minute charts, you need shorter timeframe data for it to be directly relevant.
Not combining with price structure. EWMA as a trend indicator works much better combined with SMC structure, Fibonacci levels, or order blocks. Alone it produces too many false signals.
Step-by-Step: How to Add EWMA to Your Trading
Step 1: Choose lambda = 0.94 as starting point for daily/4-hour trading.
2: Add 32-period EMA on TradingView as your EWMA equivalent.
3: Add a second 19-period EMA for the faster signal.
4: Set up Google Sheets volatility tracker — daily range + EWMA formula.
5: When volatility is 15%+ above average, widen stops and reduce size. When 15%+ below average, tighten slightly.
6: Use trend filter before every entry — price above/below 32 EMA, slope direction confirming your trade.
7: Review monthly — check if volatility-adjusted stops saved trades that fixed stops would have lost.
Why Most Retail Traders Never Discover This
The honest reason is that EWMA isn’t marketed well.
Indicators that flash buy and sell signals, that paint the chart in colors — those get attention. They sell courses.
EWMA volatility is unglamorous. It’s a number in a spreadsheet that tells you to make your stop 8 pips wider today. It doesn’t feel exciting.
But the traders who apply this kind of rigorous thinking to their risk management are the ones still trading five years later. Not because they find better setups — but because they lose less when they’re wrong.
Surviving long enough to get good is the actual goal. EWMA quietly supports that goal better than most flashier alternatives.
Frequently Asked Questions
What is the EWMA exponentially weighted moving average chart?
A chart that plots a smoothed average line giving more weight to recent prices using lambda parameter — reacts faster than SMA and reduces lag significantly.
What is the EWMA formula?
EWMA(t) = λ × EWMA(t-1) + (1 – λ) × Value(t). Lambda controls how fast old data fades — higher lambda means smoother, lower lambda means faster reaction.
What is the exponential moving average?
EMA is a moving average that weights recent prices more heavily than older ones — making it more responsive to current market conditions than a simple moving average.
How to interpret EWMA?
When price is above rising EWMA — bullish trend. When price is below falling EWMA — bearish trend. When EWMA flattens momentum is weakening and trend may be changing.
Disclaimer:
This article is for educational purposes only and does not constitute financial or investment advice. Trading involves significant risk of loss. Always conduct your own research and consider consulting a qualified financial advisor before making any trading decisions.

Hira Ch is a Forex trader and financial content writer specializing in gold, crypto, and currency markets.Based in Lahore, she breaks down complex trading
concepts into simple, actionable insights at ExpertJourny.




One Comment