What is Smart Money Concepts in Trading.For almost two years, I traded the same way most retail traders do.
Support and resistance levels. RSI overbought and oversold signals. Moving average crossovers. I had indicators stacked on indicators. My charts looked like a electrical wiring diagram.
And I was losing. Not catastrophically — just slowly, consistently. Win some, lose more. Take a good trade, give it back two trades later.
The frustrating part wasn’t the losses. It was that I couldn’t figure out why. The setups looked right. The indicators confirmed. I’d enter — and the market would move against me almost immediately, then reverse in the direction I originally thought, without me on board.
It felt personal. Like the market knew where I’d placed my stop.
Then a trader I’d been following for a while posted something that stopped me mid-scroll. He said: “The market isn’t random. It’s being driven by institutions. And institutions aren’t using RSI.”
That one sentence sent me down a six-month rabbit hole that completely changed how I trade.
What I found at the bottom of that rabbit hole was Smart Money Concepts — and once you understand it, you genuinely cannot look at a chart the same way again.
What “Smart Money” Actually Means
Smart money isn’t a compliment. It’s a term for the big players — banks, hedge funds, institutional traders, central banks — who move enormous amounts of capital through the markets every single day.
We’re talking about entities trading hundreds of millions, sometimes billions of dollars in a single session. Goldman Sachs. JP Morgan. Citadel. The big forex dealers. These players don’t buy and sell the way retail traders do. They can’t.
If JP Morgan wants to build a $500 million long position in EUR/USD, they can’t just click “buy” and be done with it. An order that size would immediately spike the price against them. They’d be buying into their own buying pressure, getting worse and worse prices the more they bought.
So they have to be smarter about it. They have to accumulate their position gradually, in ways that don’t telegraph what they’re doing — and often in ways that actively mislead retail traders into taking the opposite side.
That’s the uncomfortable truth at the heart of Smart Money Concepts: the institutions need someone to sell to when they’re buying, and someone to buy from when they’re selling. That someone is usually retail traders.
Understanding this doesn’t make you cynical. It makes you more aware of what’s actually happening on your charts.
The Moment It Clicked For Me
After I started studying SMC, I went back and looked at trades I’d lost over the previous year. Not just what happened — but why the market moved the way it did before reversing.
The pattern was almost embarrassing once I saw it.
In trade after trade, price had done the same thing: it dropped below an obvious support level — the kind of level that every retail trader had marked on their chart — triggered a wave of stop losses, then immediately reversed and shot upward.
I had seen this happen dozens of times and chalked it up to “volatility” or “stop hunting” without really thinking about what that meant.
Stop hunting isn’t random. It’s deliberate. Institutions know where retail stop losses cluster — below obvious support levels, above obvious resistance levels, just outside the previous day’s high or low. They push price into those areas to trigger the stops, which creates the liquidity they need to fill their large orders at the price they want.
That’s not conspiracy. That’s mechanics. And once you see it, you start building your trades around it instead of being a victim of it.
The Core Ideas in Smart Money Concepts
SMC has its own vocabulary. Some of it sounds complicated at first but the ideas are actually straightforward. Let me walk through the main ones.
Order Blocks
An order block is essentially the last candle (or group of candles) before a strong impulsive move. It represents the area where institutions were placing their large orders — buying or selling — before the big move happened.
When price comes back to an order block later, it often reacts strongly because institutions are either adding to their positions or defending the area.
On a chart, a bullish order block looks like the last bearish (red) candle before a strong move upward. A bearish order block is the last bullish (green) candle before a strong move downward.
I use TradingView to mark these manually. There are SMC indicator scripts available in the public library — some are decent, but I prefer marking them by eye because it forces me to actually understand what I’m looking at.
Fair Value Gaps (FVG)
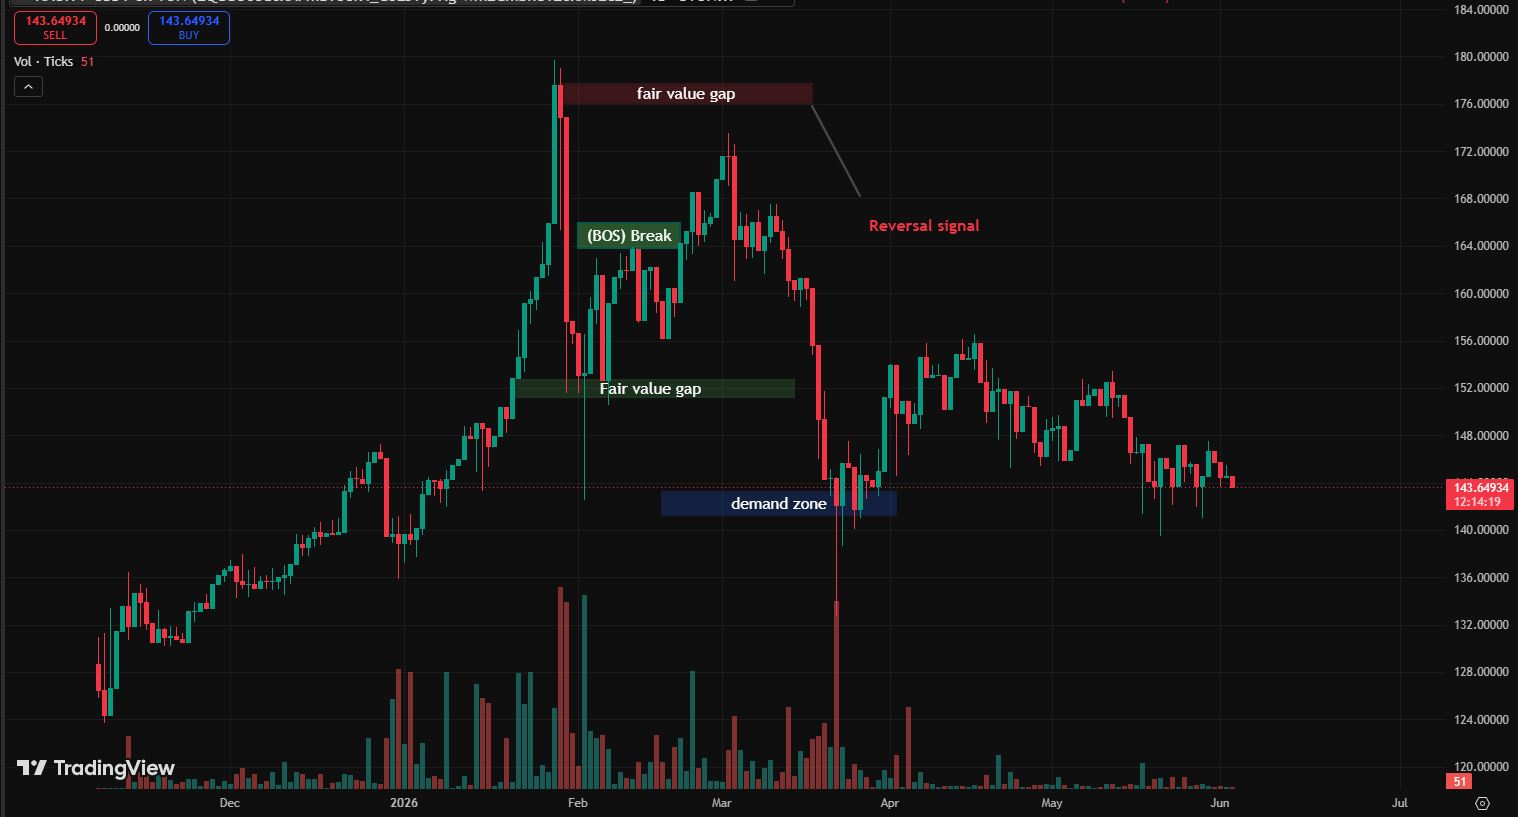
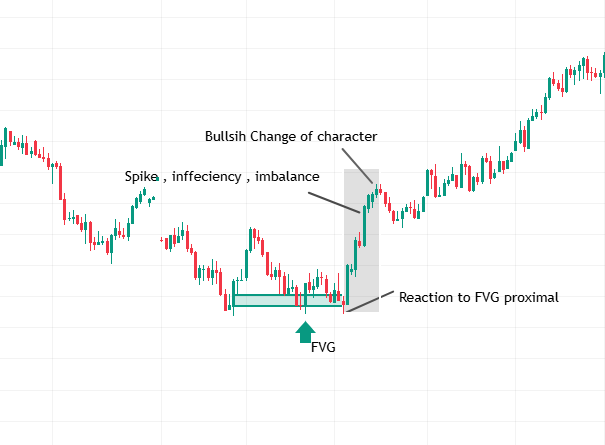
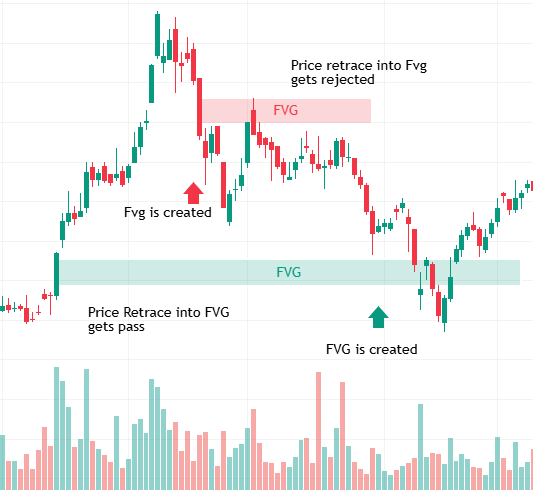
A fair value gap — sometimes called an imbalance — is a three-candle formation where the move was so fast that price left a “gap” in the market. Technically, the high of the first candle doesn’t overlap with the low of the third candle.
These gaps represent areas where not many transactions happened. The market has a tendency to come back and “fill” these gaps later — essentially revisiting the price area where the imbalance occurred.
When I see a strong bullish move with a fair value gap, I watch for price to come back and fill part of that gap before continuing upward. That fill zone becomes a potential entry area.
Break of Structure (BOS) and Change of Character (CHoCH)
Structure is how the market is moving. In an uptrend, price makes higher highs and higher lows. In a downtrend, lower highs and lower lows.
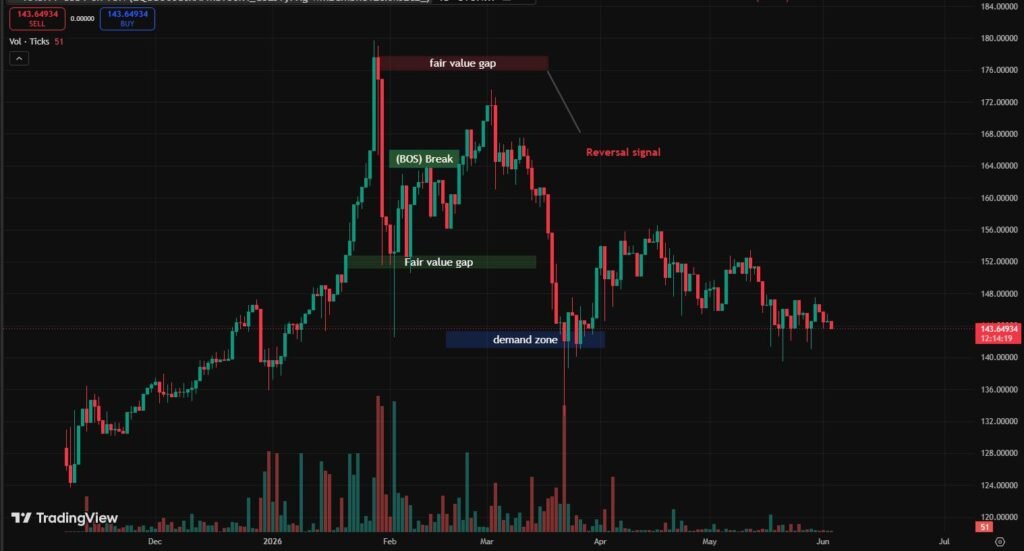
A Break of Structure (BOS) is when price breaks a previous high in an uptrend — or breaks a previous low in a downtrend. It confirms the trend is continuing.
A Change of Character (CHoCH) is different and more significant. It’s when the structure shifts — price makes a lower low in an uptrend for the first time, or a higher high in a downtrend. This signals a potential reversal.
Before I enter any trade now, I ask: what is the current structure? Is this a BOS or a CHoCH? Am I trading with the structure or against it?
Liquidity
This is the concept that made everything else make sense for me.
Institutions need liquidity to fill their large orders. Liquidity in markets exists where retail traders have their stop losses. Equal highs and equal lows on a chart are magnets for liquidity — because every trader who sold at that resistance level has their stop just above it. Every trader who bought at that support level has their stop just below it.
When price sweeps above equal highs or below equal lows and then reverses, that’s a liquidity grab. The institution took the stops, filled their orders, and now the move begins.
Once you start seeing charts through the lens of “where is the liquidity and where will price go to grab it,” your entire perspective shifts.
A Real Trade Using SMC
Let me walk you through a trade I took on GBP/USD about eight months ago using these concepts.
The daily chart showed a clear downtrend — lower highs, lower lows. Structure was bearish. On the 4-hour chart, there were equal lows sitting around 1.2480 — a level that had been tested twice and held both times. Classic liquidity pool below those lows.
I expected price to sweep those lows before any meaningful move.
On the 1-hour chart, price was approaching those equal lows with decreasing momentum. I set an alert at 1.2475 — just below the obvious level.
Price swept down to 1.2468. Took out those lows. Then — within two 1-hour candles — aggressively reversed upward. That reversal candle left a clear bullish order block at 1.2470-1.2480.
the 15-minute chart, I waited for price to come back and retest that order block from above. It did, touching 1.2478 before bouncing.
I entered long at 1.2480. Stop at 1.2455 — below the liquidity sweep low. Target at the bearish order block on the 4-hour chart sitting around 1.2620.
Price moved to 1.2618 over the next two days. I exited at 1.2610.
130 pips. Clean trade. Every decision made with a clear reason.
That’s what SMC gives you — a framework where every decision has logic behind it, not just a feeling or an indicator crossing a line.
How SMC Changed the Way I Use TradingView
Before SMC, my TradingView charts were cluttered. RSI, MACD, Bollinger Bands, three different moving averages. Looked impressive. Wasn’t helping.
Now my charts are almost empty. Price, a few key levels, and manually drawn order blocks and fair value gaps. That’s it.
The cleaner the chart, the clearer the thinking. When you’re not trying to interpret five indicators simultaneously, you can actually focus on what price is doing and why.
On TradingView I use:
- The rectangle tool to mark order blocks
- The horizontal line tool for equal highs/lows and necklines
- The Fib retracement tool to find the 50% level of order blocks (price often reacts at the midpoint)
- Price alerts at liquidity levels so I don’t have to watch the screen all day
There are public SMC indicator scripts on TradingView that auto-detect order blocks and fair value gaps. They’re useful for learning, but I’d recommend understanding the concepts manually first — the indicators can give false signals if you don’t know what you’re actually looking for.
Mistakes I Made When Learning SMC
Seeing order blocks everywhere.
When you first learn about order blocks, you start marking every candle before a move as an order block. The chart becomes as cluttered as it was with indicators. Be selective. Only mark significant moves — the ones that came with real momentum and clear intent.
Ignoring the higher timeframe structure.
I took a beautiful SMC entry on a 15-minute chart once — perfect order block retest, clean setup. Lost. Why? Because on the daily chart, price was in a strong downtrend and I was trying to buy. SMC works best when your trade direction aligns across multiple timeframes. Always check the daily first.
Confusing every liquidity sweep with a reversal.
Not every stop hunt leads to a reversal. Sometimes price sweeps a level and keeps going. I learned to wait for confirmation — a strong rejection candle, a change of character on a lower timeframe — before entering after a sweep.
Over-trading with SMC.
SMC setups — properly identified ones — don’t happen every hour. They require patience. Early on I was so excited about the new framework that I started seeing setups that weren’t really there. Forced entries with SMC logic still lose.
Not combining SMC with basic market context.
SMC is a way of reading price. It still needs to be applied with common sense — don’t fight a strong fundamental trend, don’t take entries right before major news events, don’t ignore overall market sentiment.
How to Start Learning SMC Practically
You don’t need a paid course. I learned most of what I know from free YouTube content and just spending hours on TradingView going back through historical charts.
Step 1: Learn the vocabulary first. Order blocks, fair value gaps, break of structure, change of character, liquidity. Understand what each term means before trying to trade with it.
2: Go back on charts and find examples. Open TradingView. Pick any major pair — EUR/USD, GBP/USD, Gold. Go back 6 months on the daily chart. Find every obvious liquidity sweep. Mark the order blocks before big moves. Look for fair value gaps. Just observe. Don’t trade yet.
3: Paper trade for a month. Before using real money, take at least 20-30 SMC setups on paper (TradingView has a paper trading feature). Track your entries, stops, targets, outcomes. See if the concepts are working in your hands before risking capital.
4: Start with the daily and 4-hour charts only. SMC on lower timeframes is noisier and more difficult. Build your understanding on higher timeframes where the concepts are cleaner and more reliable.
5: Keep a chart journal. Screenshot every setup you take or even just observe. Write two lines about why it was or wasn’t a valid SMC entry. Over time this builds real pattern recognition — the kind that lives in your instincts, not just your notes.
SMC vs Traditional Technical Analysis
I’m not going to tell you traditional TA is useless — that’s not true and it’s not what I believe.
Support and resistance, trend lines, chart patterns — they work. They work because enough traders use them that they become self-fulfilling in many cases.
It explains why price sometimes blows through what looked like perfect support without even pausing.
The two approaches aren’t mutually exclusive. Many traders use SMC as the primary framework and traditional patterns as confirmation. An inverse head and shoulders forming at a daily bullish order block, for example, is a significantly higher-conviction setup than either signal alone.
SMC made my traditional TA better because I understood more about what was driving price to the levels I was watching.
The Honest Reality of SMC
I want to be straight with you about something.
SMC isn’t magic. It won’t make every trade a winner. There are SMC traders who lose consistently just like there are RSI traders who lose consistently. The framework is only as good as the discipline and patience of the person applying it.
What SMC does is give you a more logical, market-mechanics-based way of reading price. It removes some of the randomness in your thinking because you’re asking better questions — where is the liquidity, what’s the structure, where are institutions likely positioned — rather than just “is RSI above 70?”
Better questions lead to better decisions. Better decisions, over enough trades, lead to better results.
But it takes time. Seriously — give yourself three to six months of study and practice before expecting to trade it consistently. The vocabulary alone takes a few weeks to absorb. Actually seeing the setups in real time takes longer.
The traders who wash out of SMC are usually the ones who watched a few YouTube videos, tried to trade it after two weeks, lost some money, and concluded the whole thing was nonsense. That’s not giving any method a fair test.
Learn it properly. Practice it consistently. Be patient with yourself.
Frequently Asked Questions
How to use smart money concepts in trading?
Identify order blocks, fair value gaps, and liquidity levels on higher timeframes. Wait for price to sweep liquidity, then enter on a retest of the order block with structure confirmation.
What is smart money in trading?
Smart money refers to banks, hedge funds, and institutions that move massive capital through markets. They drive price — retail traders simply follow their footprints.
Which is better, ICT or SMC?
Both teach the same core ideas — SMC is largely derived from ICT (Inner Circle Trader). ICT is more detailed and complex, SMC is a simplified retail-friendly version of the same concepts.
Which timeframe is best for SMC?
Daily and 4-hour charts for identifying structure and order blocks. Drop to 1-hour or 15-minute only for precise entry after higher timeframe confirms the direction.
Disclaimer:
This article is for educational purposes only and does not constitute financial or investment advice. Trading involves significant risk of loss. Always conduct your own research and consider consulting a qualified financial advisor before making any trading decisions.

Hira Ch is a Forex trader and financial content writer specializing in gold, crypto, and currency markets.Based in Lahore, she breaks down complex trading
concepts into simple, actionable insights at ExpertJourny.