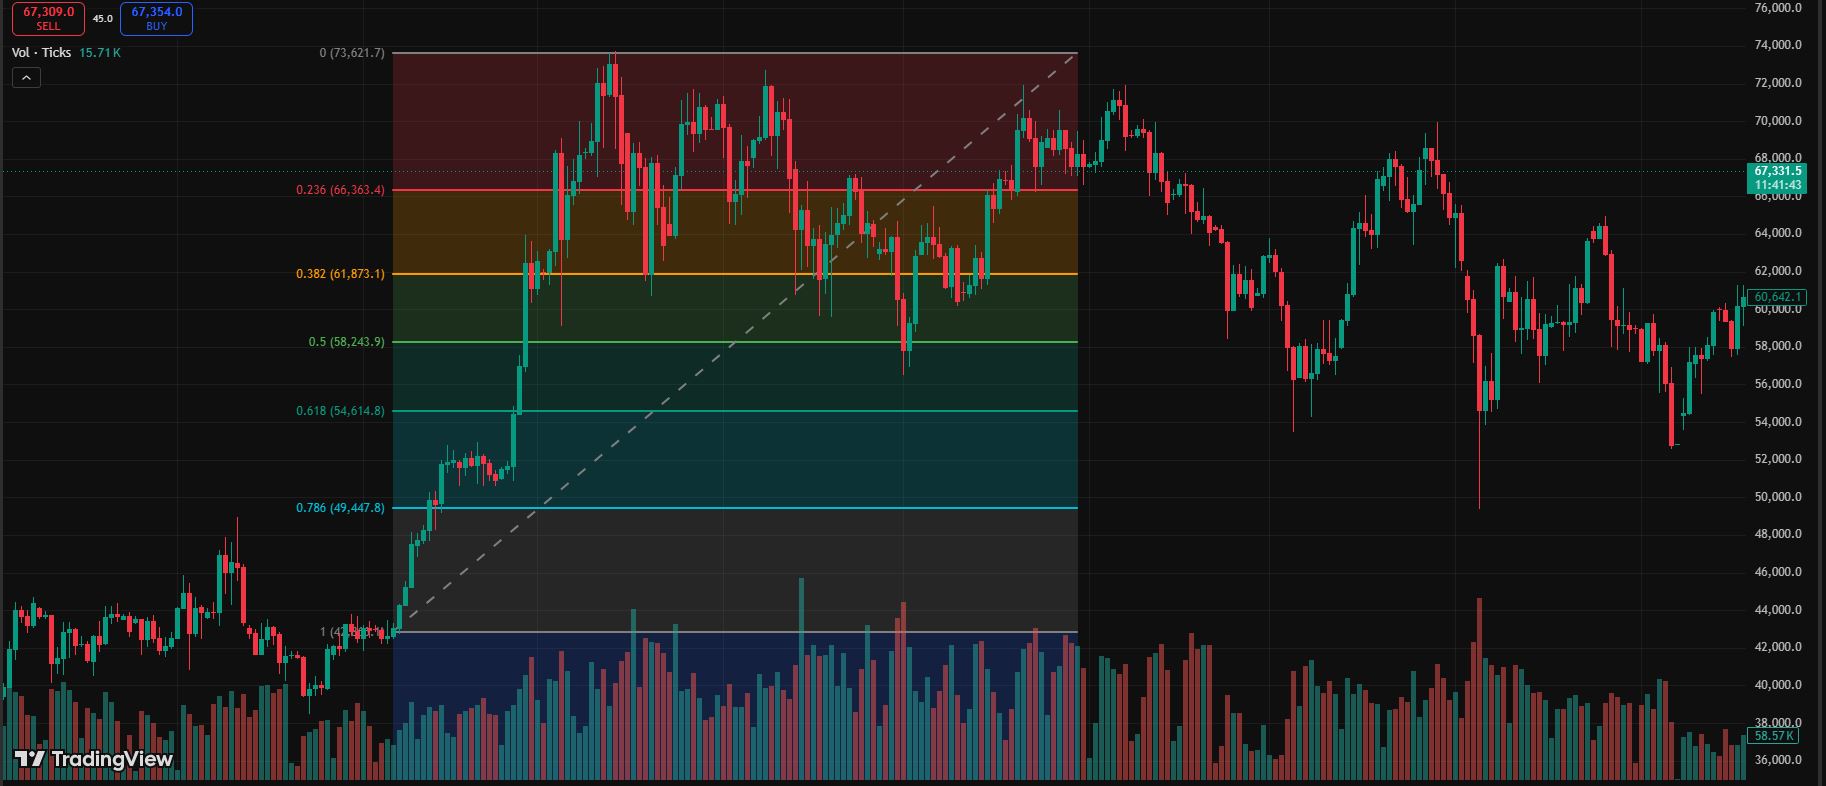
Fibonacci Retracement Calculator.I used to draw Fibonacci levels the same way I did everything else in my early trading days.
Roughly. Approximately. “Close enough.”
I’d eyeball a swing high and a swing low, drag the Fib tool across it, and then wonder why price kept missing my levels by 8, 10, sometimes 15 pips. I’d adjust the levels after the fact to make them fit. Convince myself the tool was working when it wasn’t — or that it was broken when actually I was just using it sloppily.
The levels felt random. The retracements felt random. I was getting stopped out just before price reversed in my direction more times than I could count.
Then a trader in a group I was part of mentioned offhand that he used a Fibonacci retracement calculator before marking any levels on his chart. Not TradingView’s built-in tool — an actual calculator where he input the exact swing high and low prices and got back precise retracement levels down to the pip.
I thought that sounded overly complicated. Why calculate manually what a chart tool does automatically?
He showed me a side-by-side comparison. His levels versus mine on the same chart. Same swing points, completely different precision. His 61.8% level was at 1.08764. Mine was somewhere around 1.0870 because I’d dragged the tool carelessly.
On that particular trade, price had reversed at exactly 1.08764 before continuing upward.
I had been off by 6 pips. My stop was 8 pips below my entry. I’d been stopped out. He hadn’t.
That conversation changed how seriously I took Fibonacci precision — and introduced me to using a calculator as a standard part of my pre-trade routine.
What a Fibonacci Retracement Calculator Actually Does
Before going further, let me explain what the calculator actually is — because it’s simpler than it sounds.
A Fibonacci retracement calculator takes two inputs: a swing high price and a swing low price. It then calculates the key Fibonacci retracement levels between those two points using the standard Fibonacci ratios.
Those ratios are: 23.6%, 38.2%, 50%, 61.8%, 78.6% — and sometimes 88.6% for deeper retracements.
The calculator gives you the exact price for each level. No dragging a tool across a chart. No guessing whether you anchored it correctly. Just numbers — precise, consistent, reproducible.
For example: if a swing low is at 1.0800 and a swing high is at 1.1000, the range is 200 pips. The 61.8% retracement of that range is 123.6 pips from the high, which puts the level at 1.0876.
You can do this math manually. But when you’re analyzing multiple pairs across multiple timeframes, a calculator speeds things up enormously and eliminates the arithmetic errors that happen when you’re tired or moving fast.
Why Fibonacci Levels Work at All
This is a question worth answering properly because a lot of traders use Fibonacci mechanically without understanding why price actually reacts at these levels.
The honest answer is: partly math, partly self-fulfilling prophecy, partly genuine market mechanics.
The math: Fibonacci ratios appear throughout nature and mathematics — the relationship between consecutive Fibonacci numbers converges toward 1.618 (the golden ratio). Whether or not markets are “natural” in that sense is debatable, but the ratios have been applied to financial markets for decades.
The self-fulfilling part: because so many traders and institutions mark the same Fibonacci levels, price often reacts at those levels simply because enough people are watching them and placing orders there. The 61.8% level in particular is watched by an enormous number of market participants.
The genuine mechanics: in trending markets, price rarely moves in a straight line. Pullbacks happen as early buyers take profit and new participants wait for “better prices.” The Fibonacci levels represent natural areas where pullback buying or selling tends to cluster. Institutions — the smart money players — often use these same levels to add to positions.
The combination of all three is why Fibonacci works often enough to be genuinely useful. Not always. Not magically. But consistently enough to be worth the precision.
The Key Levels and What They Mean in Practice
Not all Fibonacci levels are equal. In my experience — and this took a while to learn through actual trading — some levels matter more than others depending on the context.
The 61.8% level — the golden ratio.
This is the most respected level in Fibonacci analysis. Price reverses here more often than at any other retracement level, particularly in strong trending markets. If I had to pick one Fibonacci level to watch for the rest of my trading career, it would be this one.
When price pulls back to the 61.8% level in a strong uptrend and shows rejection — a long lower wick, a bullish engulfing candle, a rejection from an order block in the same zone — that’s a high-conviction entry area.
The 50% level.
Technically not a Fibonacci ratio — it’s just the midpoint. But markets respect it consistently enough that every serious trader watches it. Think of it as psychological middle ground. In strong trends, the 50% level is often the minimum pullback you’ll see before continuation.
The 38.2% level.
In very strong trends — the kind where momentum is clearly in one direction and pullbacks are shallow — price sometimes only retraces to 38.2% before continuing. If you only wait for 61.8% on these moves, you miss a lot of trades. Learning to identify trend strength helps you calibrate which level to watch.
The 78.6% level.
This is the deeper retracement level. When price pulls back to 78.6%, the trend is being tested more seriously. It can still be a valid entry — but it requires more confirmation. At 78.6%, you want to see a strong rejection candle and ideally confluence with another level (an order block, a previous support zone, a moving average).
The 23.6% level.
Shallow. In strong impulse moves, price might only dip to 23.6% before continuing. I rarely enter at 23.6% because the risk-to-reward is usually poor — your stop has to be wide relative to how far price has already moved.
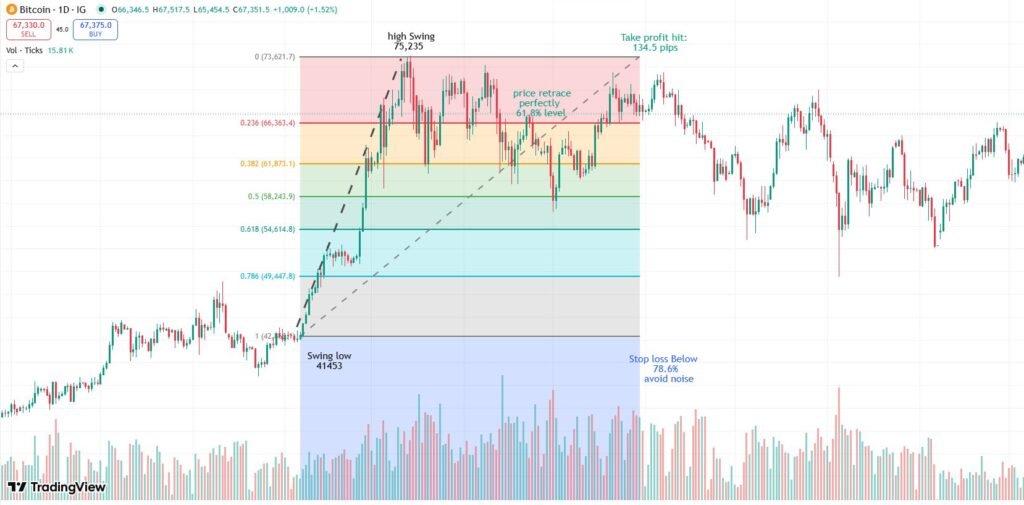
How to Use a Fibonacci Retracement Calculator Step by Step
Let me walk through my actual process — the one I use before marking any Fibonacci levels on a live chart.
1: Identify a clear swing high and swing low.
This is the most important step and where most traders get sloppy. Your swing high and swing low need to be significant turning points — not just any local peak or trough. I look for swing points that caused a clear change in direction, ideally on the 4-hour or daily chart.
The precision of your calculator output is only as good as the precision of your inputs. Get the swing points wrong and the calculated levels will be wrong too.
2: Note the exact prices.
Not approximately. Exactly. Open the candle in TradingView by clicking on it — you’ll see the exact high and low prices in the candle details panel. Use those numbers.
For a bullish retracement (price pulled back in an uptrend): your low point is the swing low and your high point is the swing high. You’re measuring how far price has retraced downward from the high.
For a bearish retracement (price pulled back in a downtrend): your high point is the swing high and your low point is the swing low. You’re measuring how far price has retraced upward from the low.
3: Input into the calculator.
There are several good free Fibonacci calculators online. I’ve used the one on Investing.com and a few standalone sites. You simply input the high price and low price, select whether you want bullish or bearish retracements, and hit calculate. The output gives you every major level instantly.
On mobile I use the calculator on Myfxbook — it’s clean, fast, and accurate.
4: Mark the levels on your chart.
Back in TradingView, I use horizontal lines — not the built-in Fib tool — to mark the calculated levels. Why? Because I can label each line with the exact price and the percentage level. When I’m watching the chart at 2 AM and price is approaching a level, I want to see “61.8% — 1.08764” right on the chart, not just a line I have to hover over to identify.
5: Look for confluence.
A Fibonacci level on its own is useful. A Fibonacci level that sits inside a daily order block, or aligns with a previous support/resistance level, or coincides with a 200 EMA — that’s a high-confluence zone. These are the entries worth waiting for.
Mark your Fibonacci levels first, then look at what else is in the same area. The more confluences, the higher the probability.
6: Set alerts.
TradingView lets you set price alerts at any level. I set alerts at the 38.2%, 50%, and 61.8% levels for any setup I’m watching. When price approaches, I get notified — I don’t have to watch the chart. Then I check the chart when the alert fires and decide whether the setup is valid.
A Real Trade Where the Calculator Made the Difference
Gold (XAU/USD) — about five months ago.
Gold had made a strong bullish move from $1,980 up to $2,085. Clear impulse. I wanted to buy the pullback.
I opened the Fibonacci calculator on Investing.com. Input: low at $1,980, high at $2,085. Range: $105.
The calculated levels came back:
- 23.6%: $2,060.27
- 38.2%: $2,044.81
- 50%: $2,032.50
- 61.8%: $2,020.19
- 78.6%: $2,002.47
On TradingView, I marked all five levels as horizontal lines with labels.
I then looked at what else was in those zones. The $2,020 area — right at the 61.8% level — sat inside a 4-hour bullish order block that had formed during the initial move up. Strong confluence.
I set an alert at $2,022.
Price pulled back over the next three days, touching $2,021.40 before showing a clear bullish rejection on the 1-hour chart — a hammer candle with a long lower wick right off the 61.8% level.
Entry: $2,023. Stop: $2,008 (below the order block). Target: $2,075 (previous high area).
Price reached $2,071 four days later. I exited at $2,068.
45 dollar move on Gold. The precision of the entry — made possible by calculating exact levels rather than eyeballing — meant my stop was tight enough to give me a solid risk-to-reward ratio.
Without the calculator, my 61.8% level might have been at $2,015 or $2,025 depending on how carefully I’d dragged the TradingView tool. Different entry, different stop placement, different outcome.
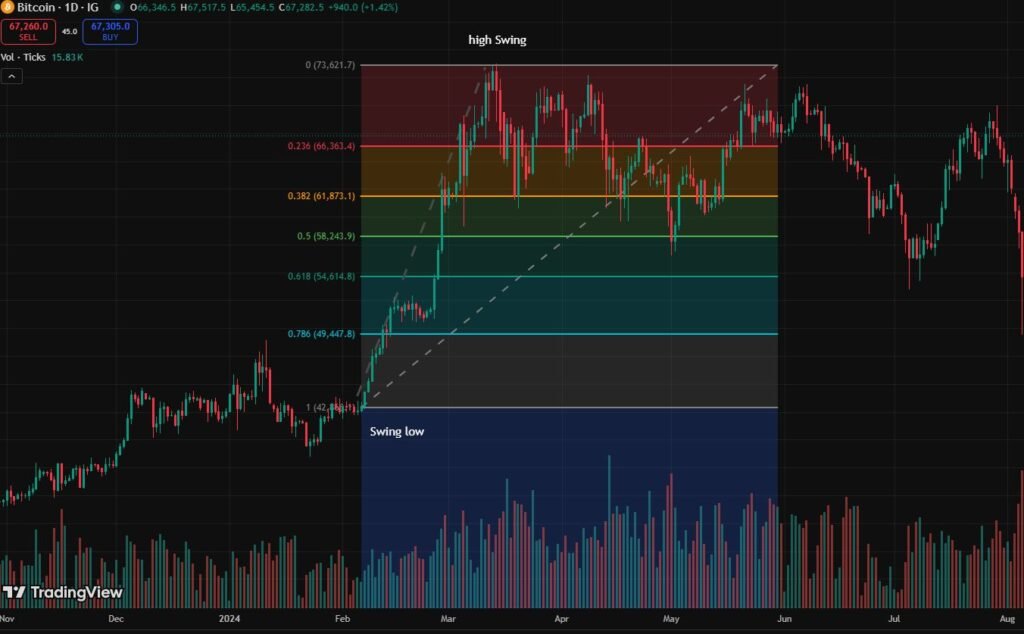
Mistakes Traders Make With Fibonacci
Using the wrong swing points.
The most common mistake. If you anchor your Fibonacci to a minor swing instead of a significant one, all your levels will be off. Always use the most obvious, significant turning points — the ones that would be visible even on a higher timeframe chart.
Treating every Fibonacci level as equally valid.
They’re not. 61.8% and 50% are the workhorses. 23.6% is often too shallow for a meaningful entry. 78.6% requires extra confirmation. Know which levels deserve your attention in which conditions.
Using Fibonacci in sideways markets.
Fibonacci retracement is a trending market tool. It measures pullbacks within trends. In a choppy, ranging market, the levels become meaningless because there’s no clear trend to retrace from. Before drawing any Fibonacci levels, confirm you’re looking at a trending market.
Ignoring the bigger picture.
I once took a 61.8% retracement entry on the 1-hour chart without checking the daily. The daily chart showed price approaching a major resistance zone. The 1-hour Fib entry looked perfect — but the daily resistance stopped the move cold. Always check higher timeframes before entering on Fibonacci levels.
Entering before price actually reaches the level.
“It’s getting close to 61.8%, I’ll get in now.” I’ve done this. Price then hits the actual 61.8% level, triggers all the stop orders, and then reverses — while I’m already stopped out from entering early. Wait for price to reach the level. Set an alert and be patient.
Not combining with other confluence.
Fibonacci levels alone are useful but not enough. A 61.8% level in the middle of nowhere — no order block, no previous support, no SMC confluence — is less reliable than the same level that aligns with multiple other factors. Always look for confluence before entering.
Tools I Actually Use for Fibonacci Analysis
TradingView — for charting. I use the built-in Fibonacci tool only to get a rough visual, then I switch to manually drawn horizontal lines based on the calculated levels. The manual lines give me cleaner, more readable charts.
Investing.com Fibonacci Calculator — free, web-based, takes 10 seconds to use. Input high and low, select retracement or extension, get results. Clean interface, accurate output.
Myfxbook Fibonacci Calculator — good mobile option. Easy to use on the phone when I’m away from the desk.
Forex Factory — not directly related to Fibonacci but essential for timing. Before I enter any Fibonacci-based trade, I check that there’s no high-impact news imminent that could spike price through my level before the setup has a chance to play out.
A simple spreadsheet — I keep a Google Sheet where I log Fibonacci setups I’m watching. Pair, swing high, swing low, key levels, what I’m waiting for. Helps me track multiple setups without forgetting them.
Fibonacci Extensions — The Other Side of the Tool
Most traders know about retracements. Fewer use Fibonacci extensions properly — and they’re just as useful for setting targets.
While retracements measure how far price pulls back within a move, extensions measure how far price might go beyond the original swing high or low after the pullback completes.
The key extension levels are 127.2%, 161.8%, and 261.8%.
In a bullish move, after price retraces to the 61.8% level and bounces, the 127.2% extension of the original move gives you a realistic first target. The 161.8% extension is the next target if momentum continues.
A Fibonacci calculator handles extensions the same way as retracements — input your swing high, swing low, and the end of the retracement, and it gives you the extension levels.
I use these to set my take profit levels instead of just eyeballing “the next resistance.” It adds the same precision to exits that the retracement calculator adds to entries.
Why Precision Matters More Than Most Traders Admit
Six pips. That’s what separated the trader I mentioned at the start of this article from a stopped-out trade.
Six pips sounds insignificant. But in forex — where stop losses are often 15-25 pips on a swing trade — six pips is the difference between being stopped out and staying in a trade that goes on to make 80 pips.
Precision in trading isn’t about being obsessive. It’s about giving your trades the best possible chance to work. You do the analysis, you identify the setup, you wait patiently for price to reach your zone — the least you can do is make sure that zone is accurately calculated.
The Fibonacci retracement calculator is a three-minute step in your pre-trade routine. Input two numbers, get five levels, mark them on your chart. That’s it.
Three minutes of precision work that can mean the difference between a trade that works and one that almost worked.
Almost only counts in other games. In trading, almost is just a loss with extra steps.
Frequently Asked Questions
What is Fibonacci calculator app?
A mobile or web tool where you input swing high and low prices to instantly get exact Fibonacci retracement levels — no manual math, no chart dragging errors.
What is Fibonacci retracement levels?
Price zones — 23.6%, 38.2%, 50%, 61.8%, 78.6% — where a trending market commonly pauses or reverses before continuing in the original direction.
What is Fibonacci calculator trading?
Using a calculator to find precise entry, stop loss, and target levels based on Fibonacci ratios — removes guesswork and improves trade accuracy significantly.
What is Fibonacci retracement chart?
A price chart with Fibonacci levels drawn between a swing high and low — visually showing where price might find support or resistance during a pullback.
Disclaimer:
This article is for educational purposes only and does not constitute financial or investment advice. Trading involves significant risk of loss. Always conduct your own research and consider consulting a qualified financial advisor before making any trading decisions.

Hira Ch is a Forex trader and financial content writer specializing in gold, crypto, and currency markets.Based in Lahore, she breaks down complex trading
concepts into simple, actionable insights at ExpertJourny.



One Comment