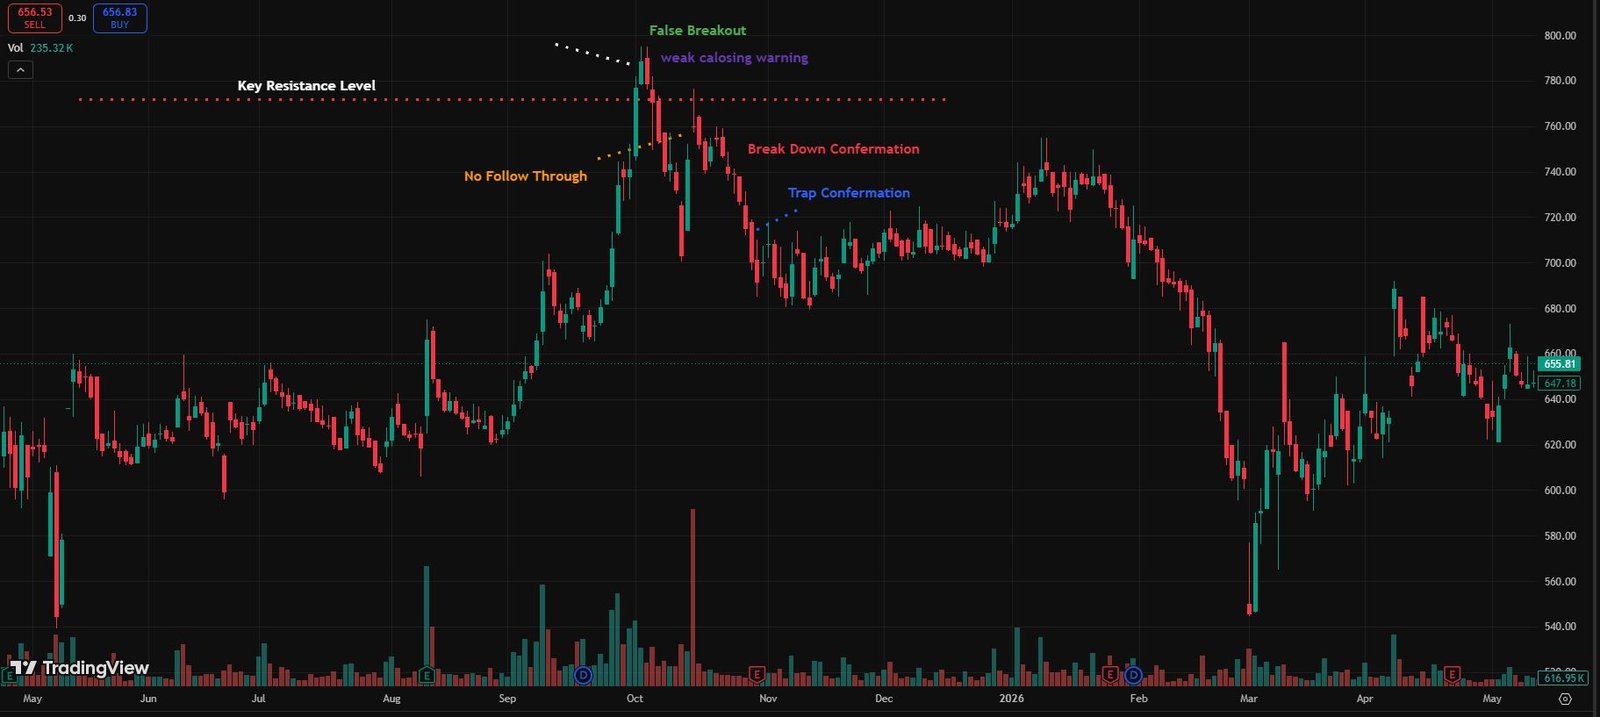
What is a Bull Trap in Stock Market.I remember sitting in front of my screen at 11 PM, chai going cold next to me, watching a stock I’d been tracking for weeks suddenly break above a resistance level that had held it down for almost two months.
My heart genuinely jumped.
This is it. This is the move.
I bought in. Not a small test position — a proper chunk of my trading capital. The kind of buy you make when you’re convinced. When the chart is screaming at you. When everything in your gut says go.
By the next morning, the stock was back below that resistance level. Not slowly. Not gradually. It gapped down hard and just kept going.
That trade taught me more about markets than any book I’d read. Not because I learned what a bull trap was from a definition — but because I lived inside one.
What Actually Happens in a Bull Trap (Before We Name It)
Here’s the thing nobody tells you clearly enough: a bull trap doesn’t look like a trap when you’re in it. It looks like an opportunity.
Picture this. A stock has been stuck below a level — say ₹500 or $50, doesn’t matter — for weeks. Every time it gets close, sellers show up and push it back down. Traders have been watching this level. It’s marked on thousands of charts.
Then one day, with some volume, the price breaks above it.
Candles close above the resistance. The breakout looks clean. People start buying. More people see it moving and jump in. It builds momentum. For a few hours — sometimes a full day — it holds above that level.
Then it reverses.
The price falls back below the resistance level. The buyers who came in on the breakout are now stuck. They bought into what looked like strength, but the strength was manufactured — or at minimum, unsupported. The sellers were waiting. Or the buyers ran out. Either way, the trap closed.
That’s a bull trap.
It’s a false breakout to the upside. The price moves in a way that signals bulls are in control — and then pulls the rug.
Why Bull Traps Keep Happening (And Why Smart People Fall For Them)
You might think only beginners fall for bull traps. That’s genuinely not true.
I’ve watched experienced traders get caught in them. I’ve been caught in them after years of trading. The reason is simple: bull traps exploit two of the most powerful things in trading — pattern recognition and the fear of missing out.
Your brain is trained to recognize breakouts as entries. A stock breaking above resistance with volume is, statistically, often a real breakout. The pattern works often enough that you can’t just ignore every breakout. That’s what makes the trap dangerous. It’s not obviously wrong. It looks like the real thing.
And then there’s the FOMO. You’ve been watching this stock for two weeks. You’ve been patient. It finally moves. The thought of watching it run 15% without you is genuinely painful. So you act.
The market absolutely knows this about human psychology. That’s not conspiracy — it’s just what happens when thousands of traders all have the same patterns on their charts and the same emotional responses.
A Real Example: The Crypto Version
Let me give you a concrete case study. Not a stock, but crypto — because the behavior is identical and more people have seen it.
In late 2021, Bitcoin was trading around $58,000-$60,000 and had strong resistance near $64,000 — the previous all-time high from April that year. Every time BTC approached $64K, it got rejected.
Then in November 2021, it broke above. New all-time high territory. Charts looked incredible. People flooded in. Influencers declared the next leg up had begun.
For about a week, it held above. Some people made money on that move. But the reversal, when it came, was brutal. Within two months, Bitcoin was trading below $35,000.
Now — was that a bull trap? Technically yes, in structure. The breakout failed to sustain. Buyers who chased the breakout above $64K got trapped.
But here’s the nuance: nobody knew in the moment it would reverse that hard. That’s the point. Bull traps are only obvious in hindsight. The skill is learning to trade breakouts with appropriate skepticism — not to avoid them completely.
How to Spot a Bull Trap Before It Closes on You
There’s no foolproof method. Anyone who tells you there is, is selling something.
But there are signs. Things that make a breakout look suspicious rather than legitimate.
Volume tells the real story.
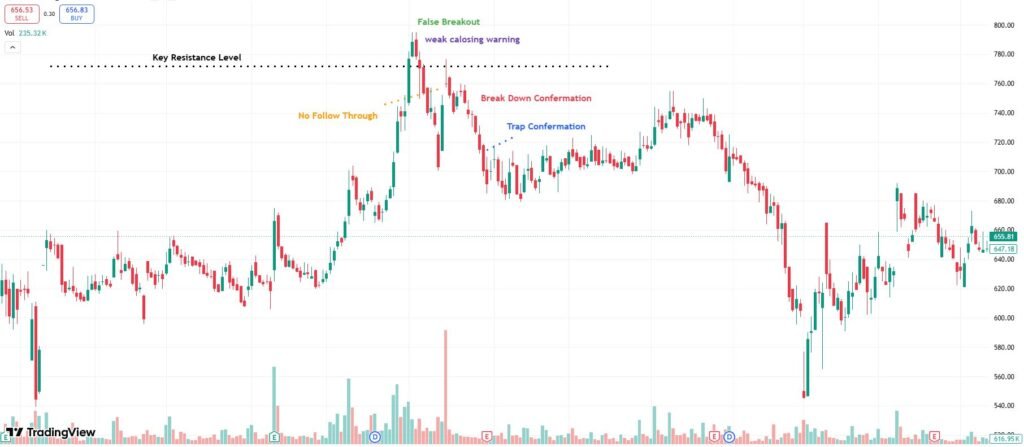
A genuine breakout usually comes with volume — more buying than usual. A bull trap often breaks out on weak or average volume. If the price clears a major level but the volume is underwhelming, be very cautious. The breakout doesn’t have enough conviction behind it.
On TradingView, this is easy to check. Add the volume indicator to your chart. When the breakout candle has lower volume than the surrounding candles, that’s a red flag.
Watch how it closes.
A real breakout usually closes near the top of the candle — strong, decisive close above the level. A potential trap often has a long upper wick. The price poked above resistance but couldn’t hold there through the candle’s close. The sellers are still active.
Check the broader market.
Is the overall market weak while this one stock is trying to break out? If Nifty or the S&P is under pressure and your stock is suddenly surging, be suspicious. Breakouts that go against market direction fail more often.
Wait for the retest.
This is the one habit that has saved me more money than almost anything else. Instead of buying the breakout, wait for the retest.
When a genuine breakout happens, the price will often pull back to the old resistance level — now acting as support — and bounce from there. That bounce is your entry. Yes, you’ll miss some of the initial move. But you’ll avoid the majority of bull traps because traps don’t successfully retest — they fall back through the level.
If the stock breaks out and immediately reverses without ever retesting from above, you just watched a bull trap in real time.
Mistakes Traders Make With Bull Traps
Buying the first candle that breaks the level.
The candle that breaks resistance is the excitement candle. It’s also the most dangerous one to enter on. Institutions and experienced traders sometimes push price through a level specifically to trigger the buy orders sitting there — then sell into that buying pressure. Wait. Just wait.
Ignoring the timeframe.
A breakout on a 5-minute chart means almost nothing. A breakout on a daily chart means more. A breakout on a weekly chart is the most significant. I’ve watched traders get excited about breakouts on tiny timeframes that were just noise inside a larger downtrend. Always zoom out. Check what the daily and weekly charts say before acting on an hourly signal.
Not having a stop loss.
This one hurts to write because I’ve done it. You buy a breakout, it starts reversing, and instead of cutting the loss, you convince yourself it’s just a pullback. A small manageable loss becomes a large painful one. If you’re trading breakouts, your stop goes just below the breakout level. The whole thesis for buying was the breakout. If the breakout fails, the thesis is dead. Exit.
Revenge trading after getting trapped.
You got caught in a bull trap. You’re down. So you immediately look for the next setup to make it back. This is when really bad trades happen. The trap wasn’t a personal attack. It was just a failed breakout. Step away, review what happened, and wait for a clear setup.
Sizing too large on breakouts.
Breakouts have higher failure rates than most people admit. Even experienced traders get caught. Your position size for a breakout trade should reflect that uncertainty. Trade smaller than you think you need to. If it works, you can add. If it doesn’t, you live to trade another day.
Tools That Help You Avoid Bull Traps
TradingView is the one I use most. Free version works fine for this. Set up horizontal lines at key resistance levels. Add volume. Add RSI. When a breakout happens, check all three before touching your keyboard.
For RSI specifically — if the RSI is already above 70 when the breakout happens, the move is already extended. Late entries into overbought territory on a breakout are extremely high risk.
MetaTrader 4/5 for forex traders has the same tools. Key concept is identical across markets.
If you’re on Binance or any crypto exchange, the TradingView chart integration is built in. No excuses for not checking volume.
One specific habit on TradingView: I draw a zone instead of a single line for resistance. Levels aren’t precise price points — they’re areas. A breakout by 0.3% might still be inside the zone, not above it. Being sloppy about “did it actually break?” is how you get trapped on fake moves.
How to Protect Yourself — Practically
Step 1: Mark your key levels in advance.
Before the trading session, identify the resistance levels you’re watching. Have them on your chart already. Don’t draw them reactively while price is moving — you’ll be sloppy.
2: When the breakout happens, don’t react immediately.
Watch the candle. Watch the volume. Wait for it to close. A one-minute candle that pokes above a level means nothing. A daily candle that closes clearly above with strong volume means something.
3: Wait for the retest.
Set an alert at the old resistance level. If price comes back to test it as support after breaking out, that’s your entry signal — not the breakout itself.
4: Define your stop before you enter.
Where does your thesis break down? Just below the breakout level. If price falls back through that level and closes below, you exit. Non-negotiable.
5: Keep position size appropriate to the uncertainty.
Breakout trades have maybe a 40-50% success rate even when you do everything right. That’s not a reason to avoid them — the winners can be large. But size accordingly.
6: Review your breakout trades separately.
Keep a simple log. Which breakouts held? Which failed? Over time you’ll start to see patterns specific to the stocks or timeframes you trade. That knowledge is worth more than any indicator.
The Bigger Picture
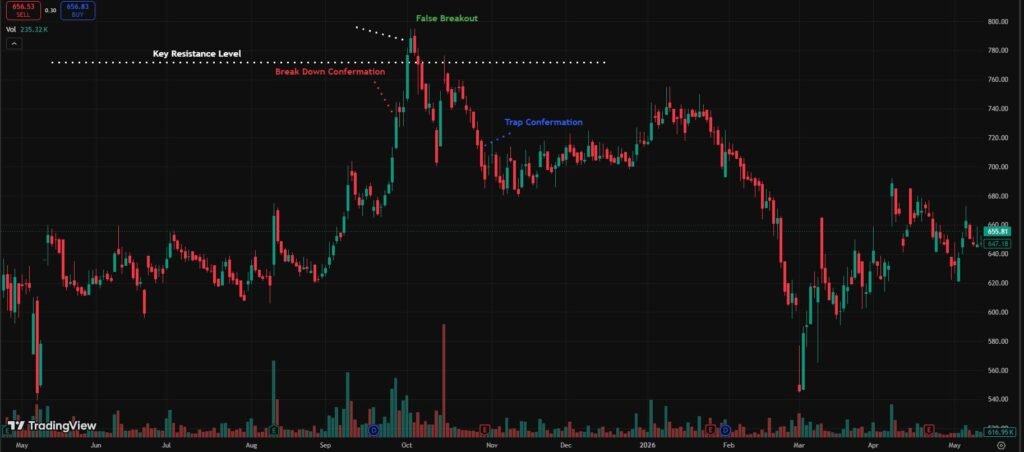
Here’s what nobody really talks about with bull traps: getting caught in one isn’t the problem. It’s going to happen. The traders who survive and eventually do well aren’t the ones who never get trapped — they’re the ones who lose small when they do.
The trap only becomes catastrophic when you have no stop, when you sized too large, or when you refuse to accept the trade is wrong and let a small loss become a devastating one.
Markets are designed, in a sense, to take money from impatient people and give it to patient ones. The breakout that triggers your FOMO and pulls you in too early — that’s the market doing what it does. Your job isn’t to outsmart it completely. Your job is to limit what it can take from you when it catches you.
Emmanuel — a trader I know who works in cross-border imports — once told me something that stuck: “The market doesn’t know you exist. It’s not targeting you. When you lose, it’s just because you were positioned wrong, not because you were wrong.”
That reframing helped me stop taking losses personally. A bull trap caught you. Okay. Cut the loss, learn what you can from the setup, move on.
The traders who last aren’t the smartest ones. They’re the most disciplined ones.
Frequently Asked Questions
Why do 90% option traders lose money?
Because they trade on emotions, not strategy. Overtrading, no risk management, and chasing losses wipe out most accounts fast.
Is bull trap bullish or bearish?
It looks bullish but it’s actually bearish. Price fakes a breakout upward — then reverses hard downward.
How to detect bull trap?
|
Watch the volume — if breakout happens on weak volume with no retest, it’s likely a trap. Wait, don’t chase.
How to earn $1000 per day in trading?
Focus on capital first, not daily targets. $1000/day needs serious capital and consistent strategy — there’s no shortcut.
Conclusion:
That night I got trapped — cold chai, gapped-down stock, staring at a red screen — I didn’t feel angry. I felt stupid.
But here’s what I eventually understood: the bull trap didn’t beat me because it was clever. It beat me because I was impatient. I chased the candle instead of waiting for confirmation. That’s it. That’s the whole lesson.
All the technical stuff — volume checks, retest strategy, stop placement — it only works if your emotions aren’t running the show. And in that moment, mine absolutely were.
The market has been trapping eager buyers since long before charts existed. No indicator makes you immune. What changes — if you’re actually paying attention — is how little it takes from you each time it happens.
The traders who last aren’t the ones who never get caught. They’re the ones who get trapped, lose 1%, and move on without drama.
So if you just got caught in one: cut the loss, write down what went wrong, and close the charts for today. Come back tomorrow with fresh eyes.
The market will give you another setup. It always does.
The only question is whether you’ll be smarter the next time — or whether you’ll repeat the same mistake on a different chart.

Hira Ch is a Forex trader and financial content writer specializing in gold, crypto, and currency markets.Based in Lahore, she breaks down complex trading
concepts into simple, actionable insights at ExpertJourny.