I spent eight months looking for a trading system that actually worked consistently.
Not worked once. Not worked in backtests on cherry-picked data. Actually worked — day after day, week after week, in real market conditions with real money on the line.
I tried everything. RSI divergence. MACD crossovers. Bollinger Band squeezes. Each one worked brilliantly in the charts I used to discover it, then underperformed the moment I traded it live.
The problem, I eventually realized, wasn’t the indicators. It was me. I kept overriding signals. Second-guessing entries. Cutting winners short because I was nervous. Holding losers because I was convinced they’d turn around.
Then I stumbled onto the story of the Turtle Traders — and specifically, the Donchian Channel system they used. It wasn’t flashy. It didn’t use any of the indicators I’d been obsessing over. It was almost absurdly simple.
And it was exactly what I needed.
The Turtle Trader Story — Why This System Exists
In 1983, legendary trader Richard Dennis made a bet with his partner William Eckhardt. Dennis believed trading could be taught to anyone. Eckhardt disagreed — he thought successful trading required natural talent and instinct.
To settle the argument, they recruited 23 ordinary people — the “Turtles” — with no trading experience and taught them a specific, rules-based system. Then they gave them real money to trade.
The result? The Turtles generated over $100 million in profits over the following years.
The system they used was built around Donchian Channels — specifically two versions of it: a 20-period channel and a 55-period channel. These two parameters became the foundation of what traders now call the Turtle Trading System.
I’m not telling you this to hype it up. I’m telling you because understanding where the system came from explains why it’s built the way it is — and why the specific parameters matter.
What a Donchian Channel Actually Is
Before getting into the 20/55 parameters specifically, let me explain what a Donchian Channel is for anyone who hasn’t used one.
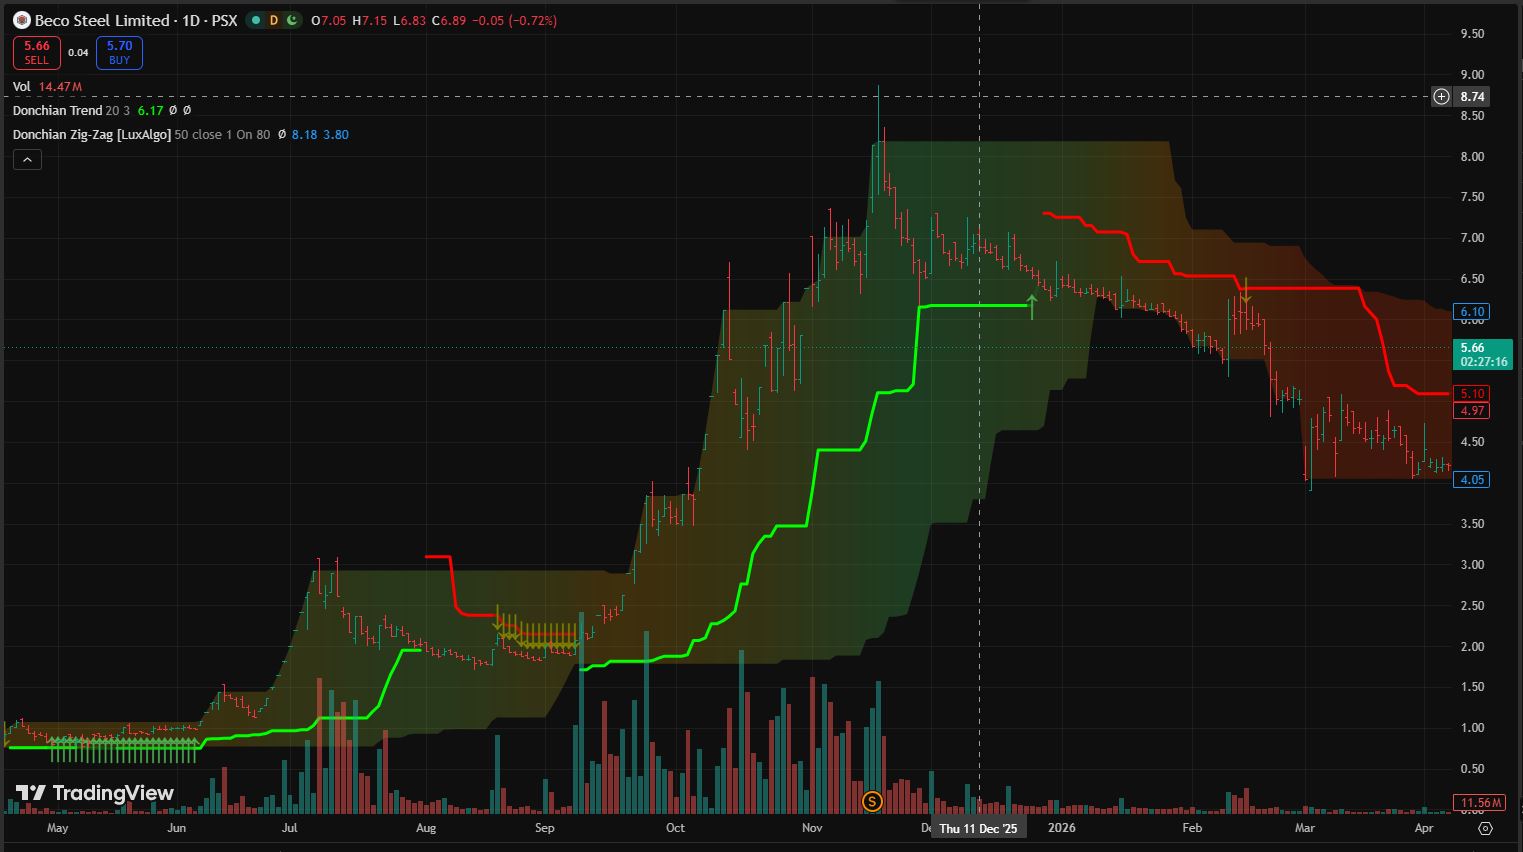
A Donchian Channel plots three lines on your chart:
The upper band — the highest price over the last N periods. The lower band — the lowest price over the last N periods. The middle line — the midpoint between the upper and lower bands.
That’s it. No complex math. No smoothing algorithms. Just the highest high and lowest low over a specific lookback period, with a midpoint line between them.
When price breaks above the upper band, it means price has hit a new high for that period — a potential breakout signal. When price breaks below the lower band, a new low — potential breakdown.
The simplicity is the point. The channel shows you, without any ambiguity, whether price is doing something new or just moving within its recent range.
The 20/55 Parameters — Why These Specific Numbers
The Turtle system used two Donchian Channel settings simultaneously, each serving a different purpose.
The 20-period Donchian Channel — System 1
This is the shorter, more active channel. A breakout above the 20-period high triggers a long entry. A breakout below the 20-period low triggers a short entry.
System 1 catches more moves — but also generates more false breakouts. The Turtles had a specific filter for this: if the previous breakout on the 20-period channel was a winning trade, they would skip the next signal. If the previous breakout was a losing trade, they’d take the next one.
The logic: consecutive false breakouts in the same direction are less likely than alternating ones.
The 55-period Donchian Channel — System 2
This is the longer, more reliable channel. A breakout above the 55-period high is a bigger deal — it means price has made a new high for over two months of daily data. These signals are rarer but significantly more reliable.
The Turtles treated System 2 as the primary system. System 1 was supplementary — more trades, smaller position sizes, tighter management.
Why 20 and 55 specifically?
Approximately one month of trading days (20) and approximately one quarter (55). These are natural market rhythms — monthly and quarterly cycles that institutional traders and fund managers pay attention to. When price breaks out of a monthly or quarterly range, it tends to attract significant institutional participation, which sustains the move.
I’ve tested other parameters — 10/40, 15/50, 25/60. None of them performed as consistently as 20/55 across the markets and timeframes I traded. There’s nothing magical about the numbers, but decades of real trading have validated them in a way that arbitrary alternatives haven’t matched.
How I Set This Up on TradingView
TradingView has a built-in Donchian Channel indicator. Here’s exactly how I set it up:
Step 1: Open any chart — I start with daily timeframe on major forex pairs or commodities.
Step 2: Click “Indicators” → search “Donchian Channels” → add it.
Step 3: In settings, change the length to 20 for System 1. Change the color to something clear — I use blue for the upper band, red for the lower band.
Step 4: Add a second Donchian Channel indicator. Change the length to 55. I use different colors — orange upper, purple lower — so the two channels are visually distinct.
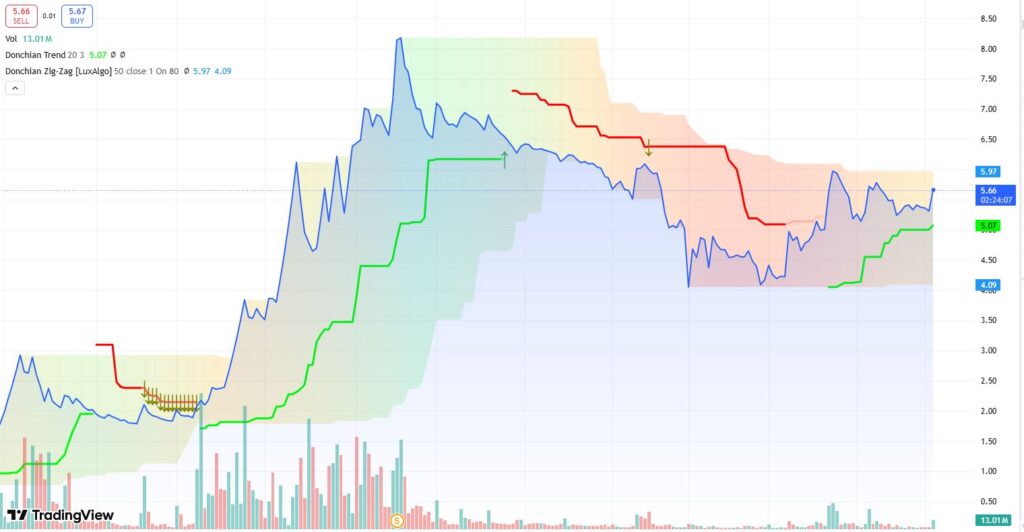
Now you have both channels on your chart simultaneously. The inner channel (20-period) will be tighter — it reacts faster to recent price action. The outer channel (55-period) will be wider and slower-moving.
When price breaks above the 20-period upper band but is still inside the 55-period channel, that’s a System 1 signal — valid but lower conviction.
When price breaks above the 55-period upper band, that’s a System 2 signal — higher conviction, bigger potential move.
The Complete Entry Rules
This is where most traders get confused about the Turtle system — they understand the channels but not the full entry framework.
1 Long Entry: Price closes above the 20-period Donchian upper band AND the previous 20-period breakout was not a profitable trade.
2 Long Entry: Price closes above the 55-period Donchian upper band. No filter needed — all signals are taken.
1 Short Entry: Price closes below the 20-period Donchian lower band AND the previous 20-period breakout was not a profitable trade.
2 Short Entry: Price closes below the 55-period Donchian lower band. All signals taken.
I personally focus almost entirely on System 2 — the 55-period channel. The reason is practical: System 1 requires you to track whether the previous signal was profitable, which adds complexity and judgment calls. System 2 is completely mechanical — every breakout gets traded, no exceptions.
Mechanical = consistent = easier to actually follow.
Position Sizing — The Part Most Traders Skip
Here’s where the Turtle system is genuinely different from almost everything in retail trading education.
The Turtles didn’t use fixed position sizes. They sized every position based on the current volatility of the market they were trading — using a measure called N, which is essentially a 20-period ATR (Average True Range).
The idea: if a market is volatile, you trade a smaller position. If it’s less volatile, you trade a larger position. The goal is that every trade risks roughly the same dollar amount regardless of how volatile the instrument is.
The formula:
Dollar Volatility = N × Dollar value per point Unit size = (Account × 1%) ÷ Dollar Volatility
For forex, this translates to:
Unit size = (Account × 1%) ÷ (ATR in pips × pip value)
Example: $10,000 account. EUR/USD ATR is 80 pips. Pip value on a standard lot = $10.
Dollar Volatility = 80 × $10 = $800 Unit size = ($10,000 × 1%) ÷ $800 = $100 ÷ $800 = 0.125 lots
You’d trade 0.125 standard lots — or about 1.25 mini lots.
I use the ATR indicator on TradingView (set to 20 periods) to get the current ATR figure. This calculation takes about 60 seconds and determines exactly how large my position should be. No guessing. No “feeling” about whether to trade bigger or smaller.
Stop Loss Rules — The 2N Stop
The Turtles used a specific stop loss distance: 2N below the entry for longs, 2N above the entry for shorts.
N being the same ATR figure used for position sizing.
If ATR on EUR/USD is 80 pips, your stop goes 160 pips away from entry.
This sounds wide. For a trader used to 20-30 pip stops, 160 pips feels terrifying. But remember — your position size was calculated specifically so that 2N of movement = 1% of your account. The wide stop combined with the small position size keeps your actual dollar risk the same as any other trade.
The logic of the 2N stop: trends don’t move in straight lines. They pull back. A 2N stop gives the trade enough room to breathe through normal volatility without being stopped out by regular market noise.
I tested tighter stops on this system — 1N, 1.5N. Both resulted in dramatically higher stop-out rates on trades that would have eventually been profitable. The 2N stop is not arbitrary. It’s calibrated to market volatility in a way that tighter stops aren’t.
Exit Rules — The Donchian Exit
Here’s something that surprises most traders about the Turtle system: exits are also based on Donchian Channels.
System 1 exit: Close the position when price hits the 10-period Donchian opposite band. Long position exit: price touches the 10-period lower band. Short position exit: price touches the 10-period upper band.
System 2 exit: Close the position when price hits the 20-period Donchian opposite band. Long position exit: price touches the 20-period lower band. Short position exit: price touches the 20-period upper band.
This means for a System 2 trade, you enter on a 55-period breakout and exit when price pulls back to the 20-period lower band.
The exit is intentionally “late” — you give back some profit to let winners run as far as possible. Trend following works on asymmetry: many small losses, occasional large winners. If you exit too early, you clip the winners that make the whole system profitable.
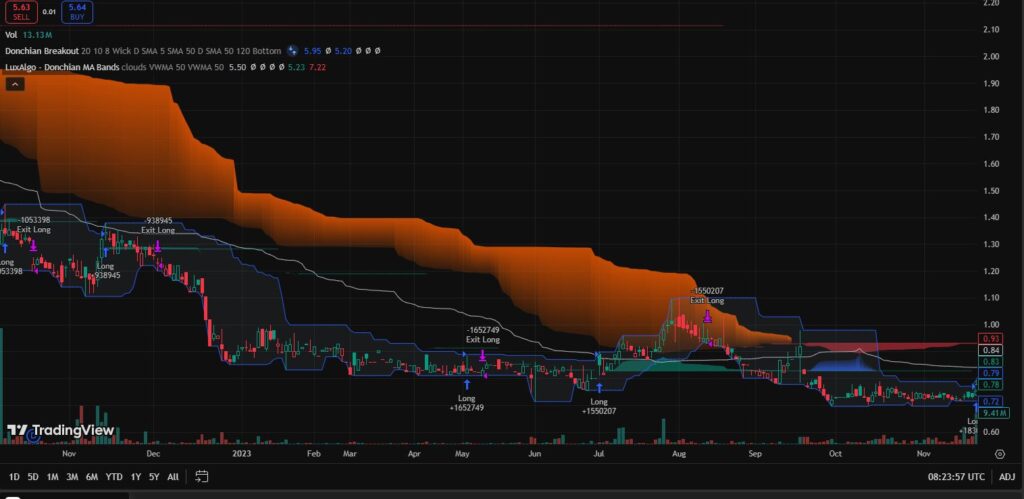
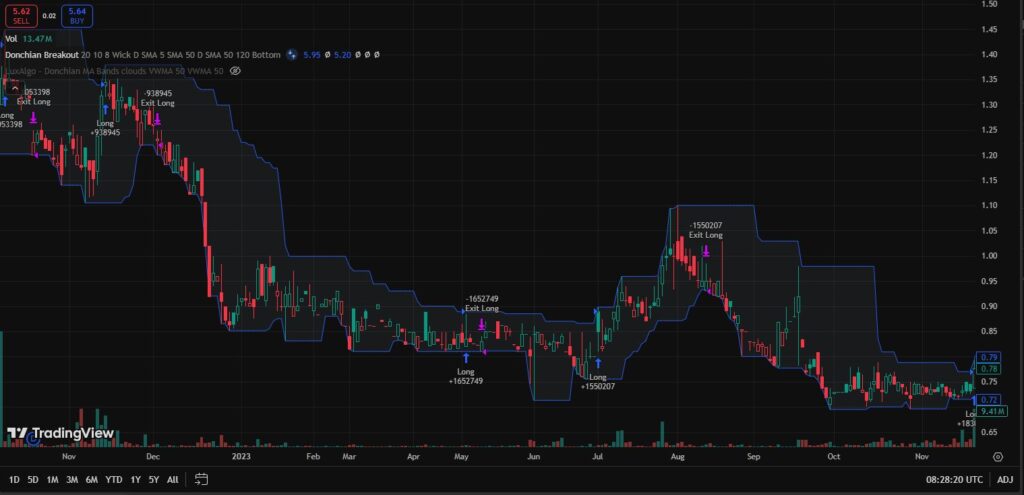
Add a 10-period Donchian Channel in a different color on your TradingView chart specifically for System 1 exits. This gives you three channels visible simultaneously — 55, 20, and 10. Visually it looks busy at first, but once you understand what each one represents, it’s actually very clear.
A Real Trade Using This System
Gold (XAU/USD) — daily chart, about six months ago.
Gold had been ranging between roughly $1,980 and $2,050 for several weeks. The 55-period Donchian upper band was sitting around $2,048.
One Monday, Gold closed at $2,055 — above the 55-period upper band. System 2 entry signal.
I checked the 20-period ATR: 22 dollars per day. That’s my N value.
Position sizing: ($8,000 account × 1%) ÷ (22 × $1 per dollar move per troy ounce for a mini contract) = $80 ÷ $22 = 3.6 units. I took 3 mini contracts.
Stop loss: 2N below entry = 2 × $22 = $44 below $2,055 = stop at $2,011.
Entry: $2,055. Stop: $2,011. Risk: approximately $80 — exactly 1% of account. ✅
Over the following three weeks, Gold moved to $2,145. The 20-period Donchian lower band eventually rose to $2,098 as price moved higher.
When Gold pulled back and touched $2,098, I exited all three contracts.
Exit: $2,098. Profit: $43 per ounce × 3 mini contracts = approximately $129. That’s 1.6% of the account on a single trade — with only 1% at risk.
The beauty of the system: I didn’t decide when to exit. The channel told me. No emotion. No second-guessing.
Mistakes I Made Learning This System
Not being mechanical enough.
The Turtle system is rules-based. The moment you start overriding signals — “I’ll skip this one because the trend looks tired” or “I’ll exit early because I want to lock in profit” — you break the system. The rules exist for a reason. Follow them exactly or don’t use the system at all.
Trading too many markets simultaneously.
The original Turtles traded 20+ markets across multiple asset classes. For a retail trader managing their own account, that’s overwhelming. I started with 3-4 pairs — EUR/USD, GBP/USD, Gold, and Crude Oil. That’s manageable and still gives you enough opportunities.
Ignoring the ATR-based position sizing.
For the first two months I used this system, I kept my old fixed position sizes. The results were inconsistent — sometimes I’d risk too much on volatile markets, too little on calm ones. The moment I switched to proper ATR-based sizing, the equity curve smoothed out dramatically.
Expecting too many signals.
System 2 on daily charts might give you 2-3 signals per market per month. Across 4 markets that’s maybe 8-12 trades per month. If you’re used to scalping or day trading, this feels agonizingly slow. But each signal is high quality. Patience is the actual skill this system teaches.
Getting discouraged during drawdowns.
Trend following systems have periods — sometimes months — where false breakouts dominate and the account draws down. This is normal. The Turtles experienced drawdowns of 20-30% before their biggest winning periods. Knowing this intellectually and experiencing it with real money are very different things. If you’re not prepared for the drawdown phases, you’ll abandon the system right before it starts working.
Which Markets Work Best
The Turtle system was designed for trending markets — it performs poorly in choppy, ranging conditions.
Best markets for this system:
Forex majors with clear trends — EUR/USD, GBP/USD, USD/JPY during trending phases.
Commodities — Gold, Silver, Crude Oil. These trend strongly and for extended periods.
Indices — in strong bull or bear markets, indices trend beautifully on the 55-period channel.
Markets to avoid:
Highly correlated pairs — don’t trade EUR/USD and EUR/GBP simultaneously. When one breaks out, the other often does too, meaning you’re essentially doubling your position in the same direction without realizing it.
Very low liquidity instruments — thin markets create false breakouts constantly. Stick to the most liquid instruments in each asset class.
Step-by-Step: How to Start Trading This System
Step 1: Open TradingView. Add three Donchian Channel indicators — lengths 55, 20, and 10. Use distinct colors for each.
2: Add ATR indicator, length 20. This gives you your N value for position sizing.
3: Start with the daily chart. Watch for price closes above the 55-period upper band (System 2 long) or below the 55-period lower band (System 2 short).
4: When a signal occurs, calculate your position size using the ATR formula. Set your stop at 2N from entry.
5: Set an alert on the 20-period Donchian lower band (for longs) — this is your exit level. When price touches it, you exit.
6: Track every trade in a spreadsheet. Entry, exit, N value, position size, outcome. After 20 trades, review the data.
7: Paper trade for at least one month before risking real capital. The system feels simple but the psychology of holding through pullbacks is harder than it looks.
Why This System Still Works Decades Later
The Turtle system was developed in the early 1980s. Financial markets have changed dramatically since then — algorithmic trading, high frequency firms, derivatives of derivatives. Yet the 20/55 Donchian breakout system still produces results.
Why?
Because it’s based on human psychology, not market structure. Breakouts happen because traders are emotionally committed to ranges — they buy support and sell resistance until the range breaks. When it does break, the same psychology that kept traders range-bound now works against them. They cover losing positions, chasing the move. New participants pile in.
Algorithms haven’t eliminated this dynamic. They’ve amplified it. More participants watch the same levels. When they break, the reaction is faster and often larger.
The 55-period Donchian Channel just makes this visible in a clean, unambiguous way. That’s why it works. Not because of the math. Because of what the math is measuring.
The Real Lesson From the Turtle Experiment
Richard Dennis proved his point. Trading can be taught.
But what the Turtle experiment actually demonstrated isn’t that any system works — it’s that a rules-based system followed consistently and without override outperforms most discretionary trading.
The Turtles didn’t succeed because the 20/55 Donchian Channel is magic. They succeeded because they had clear rules and followed them mechanically while most retail traders were (and still are) making emotional decisions.
That’s the edge. Not the indicator. The discipline to follow the indicator’s signals even when it feels wrong.
I still use this system as a core framework in my own trading. Not as the only tool — I combine it with SMC structure and Fibonacci confluence for entries — but the 55-period Donchian Channel is always on my daily charts. It gives me the big picture trend direction that everything else is filtered through.
Start with the 55-period. Watch where the breakouts happen. Paper trade it for a month. See how your instincts compare to what the channel is telling you.
Most traders find their instincts are worse than the channel. That discovery — uncomfortable as it is — is worth more than any trade you’ll ever make.
Frequently Asked Questions
What is Donchian Channel strategy PDF?
A downloadable guide explaining Donchian Channel breakout rules, position sizing, and turtle trading parameters — the 20/55 system used by professional trend followers.
What is Donchian Channel indicator?
A chart indicator showing the highest high and lowest low over a set period — upper and lower bands reveal breakout levels and trend direction clearly.
Donchian Channel vs Bollinger Bands?
Donchian Channel uses pure price highs and lows — better for breakout trading. Bollinger Bands use standard deviation — better for volatility measurement. Both serve different purposes.
What is Donchian Channel breakout strategy?
Buy when price closes above the upper band, sell when it closes below the lower band. The 55-period breakout is the strongest signal used in the classic Turtle Trading System.
Disclaimer:
This article is for educational purposes only and does not constitute financial or investment advice. Trading involves significant risk of loss. Always conduct your own research and consider consulting a qualified financial advisor before making any trading decisions.
Hira Ch is a Forex trader and financial content writer specializing in gold, crypto, and currency markets.Based in Lahore, she breaks down complex trading
concepts into simple, actionable insights at ExpertJourny.