Volume Profile Trading .For the longest time, I was that trader who drew support and resistance levels based on vibes.
Not literally. I had reasons. Previous highs, previous lows, round numbers, trendlines. All the standard stuff. But if I’m being honest, there was always a degree of guesswork involved. Why did price bounce there and not three pips lower? Why did it reverse at that level and not the one I had marked?
I couldn’t always answer that question with confidence.
Then I came across volume profile — and for the first time, I had an actual answer. Not a pattern-based guess. Not a “this level looks important” feeling. A data-based reason grounded in where real transactions had actually happened.
It changed how I read charts permanently.
Let me explain it the way I wish someone had explained it to me — before I wasted two years trading without it.
What Volume Profile Actually Is
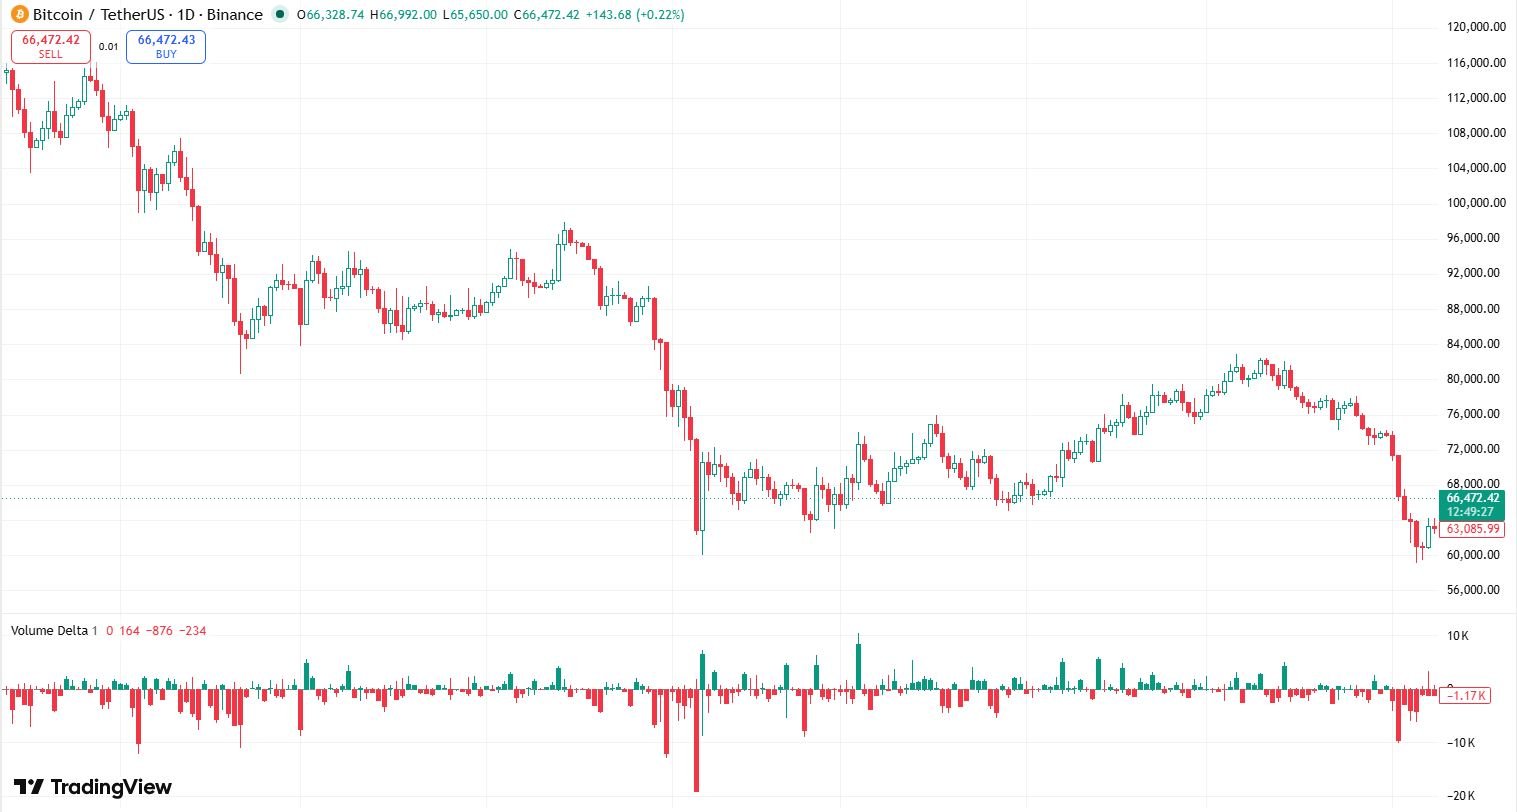
Most traders are familiar with the standard volume indicator — the bars at the bottom of the chart that show how much was traded in each time period. High volume bar, low volume bar. You’ve seen it.
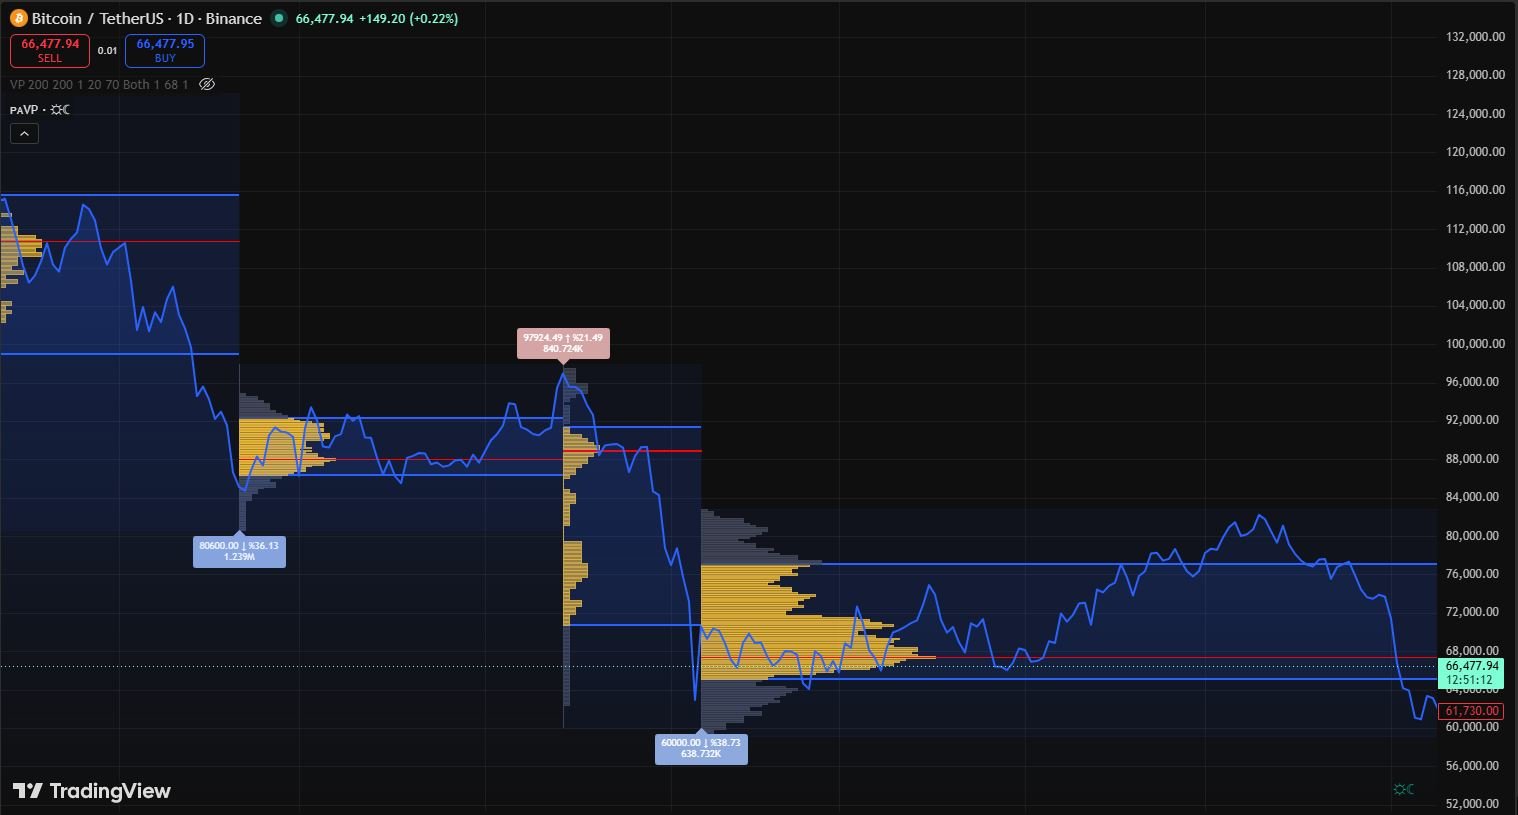
Volume profile is different. Instead of showing volume across time, it shows volume across price levels.
It answers a completely different question. Instead of “how much was traded in the last hour,” it tells you “at which price levels has the most trading activity occurred?”
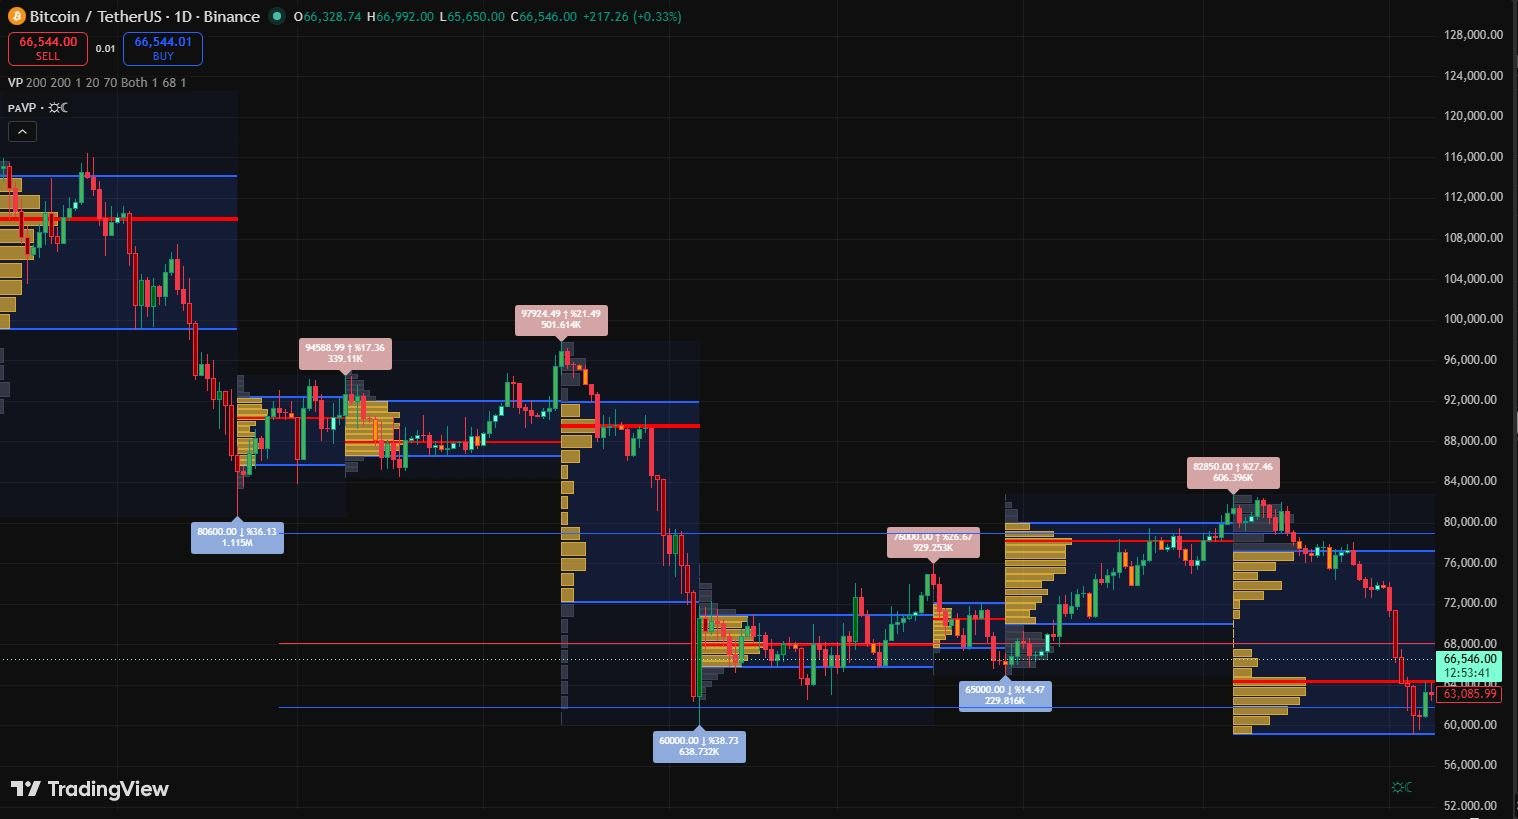
The result is a horizontal histogram displayed on the right side of your chart. Tall bars at certain price levels mean a lot of transactions happened there. Short bars mean very little activity.
That distribution of activity tells you something fundamental about the market — where participants have been most engaged, where they’ve been least interested, and therefore where price is likely to find support, resistance, or make fast moves.
Once you understand this, you start reading charts in a completely different way.
The Key Concepts — Explained Simply
Volume profile has its own vocabulary. It sounds complicated at first but each concept is actually straightforward.
Point of Control (POC)
The Point of Control is the single price level with the highest volume in the profile. More transactions happened here than anywhere else in the selected range.
Think of the POC as the “fair value” area — the price where buyers and sellers were most in agreement over the period you’re analyzing. Price tends to gravitate back toward the POC after moving away from it, similar to how a rubber band snaps back.
When I see price trading well above the POC, I know that at some point — not necessarily immediately — there’s a gravitational pull back toward that level. It doesn’t mean I short everything above the POC, but it’s context that informs my thinking.
Value Area (VA)
The Value Area is the price range where approximately 70% of all trading activity occurred. It has an upper boundary (Value Area High, or VAH) and a lower boundary (Value Area Low, or VAL).
This 70% figure isn’t arbitrary — it comes from standard distribution in statistics. The value area represents where the market spent most of its time transacting. It’s the “accepted range” for that period.
The VAH and VAL become significant levels. When price approaches the VAH from below, you’re entering a zone where a lot of previous selling happened — potential resistance. When price drops to the VAL, you’re approaching where a lot of previous buying happened — potential support.
High Volume Nodes (HVN)
High Volume Nodes are price areas with significantly above-average volume in the profile — they look like fat sections in the histogram. These are areas of price acceptance. Price spent time here. Participants were comfortable trading at these levels.
When price enters an HVN, it tends to slow down. The abundance of historical activity creates a “sticky” zone — price often consolidates in these areas before eventually breaking out.
Low Volume Nodes (LVN)
Low Volume Nodes are the opposite — price areas with very little historical trading activity. Thin sections in the histogram. These are areas of price rejection — price moved through quickly without much participation.
LVNs are some of the most powerful levels in volume profile analysis. When price approaches an LVN from either side, it tends to move through it rapidly. There’s no historical support or resistance there — nothing to slow the move down.
This is particularly useful for setting targets. If I’m long and there’s an LVN above my entry, I know price may move quickly through that zone. I adjust my target accordingly.
Why Volume Profile Works — The Logic Behind It
Support and resistance from traditional technical analysis works partly because of psychology (traders remember key levels) and partly because of orders (stop losses cluster at obvious levels).
Volume profile support and resistance works for a more fundamental reason: it reflects where actual transactions occurred.
When a large institution buys a significant position at a certain price level, those transactions show up in the volume profile. If price comes back to that level, the institution may defend it — adding more buying pressure to protect their original position.
This isn’t theory. It’s basic market mechanics. Large players don’t just walk away from positions. They manage them. And the volume profile shows you where those positions were built.
That’s a fundamentally different — and in many ways more reliable — basis for support and resistance than just looking at where price previously touched a line.
How I Use Volume Profile in Real Trades
Let me walk through my actual process rather than just describing the concepts abstractly.
I primarily use TradingView for volume profile analysis. The platform has a built-in Volume Profile indicator — you can add it from the indicators menu. I use both the “Fixed Range Volume Profile” (which you draw over a specific range of candles) and the “Visible Range Volume Profile” (which automatically calculates for whatever’s visible on screen).
1: Identify the relevant range
Before adding a volume profile, I decide what range matters for the trade I’m analyzing. For a swing trade, I might look at the last 3-6 months. For a day trade, I might focus on the current week or just the previous session.
The range determines what the profile shows you. A profile drawn over the last two years tells you something different — and equally valid — than one drawn over the last two weeks. I typically use multiple timeframe profiles overlaid to get context at different scales.
2: Find the POC and Value Area
Once the profile is on the chart, I immediately identify the POC, VAH, and VAL. I mark these as horizontal lines with labels so I can see them clearly even when zoomed in on a lower timeframe.
3: Identify HVNs and LVNs
I scan the profile for notably fat sections (HVNs) and notably thin sections (LVNs). I mark these zones on the chart as well — usually with shaded rectangles.
4: Look for confluence
A volume profile level on its own is useful. A volume profile level that coincides with a previous swing high or low, an SMC order block, or a Fibonacci retracement level — that’s a significantly higher conviction zone.
I don’t enter trades based on volume profile alone. I use it as a layer of context that either supports or undermines a trade idea I’m already developing from price structure.
5: Set alerts
I use TradingView’s price alert system to notify me when price approaches key volume profile levels. The POC and VAH/VAL of the current session are always in my alert list.
A Real Trade Example — EUR/USD
About four months ago I was watching EUR/USD on the daily chart. Price had been in a range for about three weeks, consolidating between roughly 1.0720 and 1.0880.
I applied a fixed range volume profile to the entire consolidation period. The POC came in at 1.0800 — right in the middle of the range, which made sense. The Value Area High was at 1.0855 and the Value Area Low was at 1.0748.
Price was approaching the VAH at 1.0855 for the third time. On the two previous touches, it had rejected and moved back toward the POC.
Below the VAL at 1.0748, I could see a clear LVN — very little historical volume between 1.0700 and 1.0740. This told me if the VAL broke, price would likely move quickly through that zone.
I set an alert at 1.0740 — just below the VAL.
Three days later, the alert fired. Price had broken below the VAL and was testing 1.0742. I checked the 1-hour chart — clear bearish momentum, no significant support visible until 1.0650.
I entered short at 1.0738. Stop above the VAL at 1.0762. Target at 1.0660 — just above the next HVN I could see on a longer-range profile.
Price moved to 1.0668 over the following four days. I exited at 1.0672.
66 pips. Clean trade with a clear reason for every decision — entry at the LVN breakdown, stop above the VAL, target at the next HVN.
That’s volume profile giving you a complete framework for a trade, not just a reason to enter.
Volume Profile on Different Timeframes
One of the things I love about volume profile is how it scales across timeframes. You can use it on a monthly chart for big-picture context, a daily chart for swing trade planning, or a 15-minute chart for intraday entries.
The concept is the same across all of them. What changes is the time period the profile covers and therefore what the levels represent.
Session Volume Profile — shows the profile for a single trading session. Particularly useful for day traders who want to know the POC and value area for the current day. I use this on forex during the London and New York sessions.
Weekly Volume Profile — covers the current or previous week. Good for swing traders who want context for multi-day trades.
Fixed Range Volume Profile — manually drawn over any range you choose. Most flexible option. I use this to analyze specific consolidation periods, recent trend legs, or significant market moves.
Anchored Volume Profile — starts from a specific candle you choose (like a major high, low, or news event) and builds the profile from that point forward. Particularly powerful for understanding how volume has developed since a significant market event.
On TradingView, all of these are available in the indicators menu. I typically have two or three different range profiles on the same chart simultaneously — a longer-range one for context and a shorter-range one for precision.
Volume Profile in Crypto — Works Perfectly
I’ve used volume profile on forex for years but it translates directly to crypto. Bitcoin and Ethereum in particular show very clean volume profile structures.
One of the clearest examples I saw was Bitcoin in early 2024. After the post-FTX collapse lows, Bitcoin spent several months consolidating between roughly $25,000 and $31,000. The volume profile over that entire consolidation showed a massive POC at approximately $27,500 — by far the most traded price in that range.
When Bitcoin eventually broke upward in late 2023, it moved rapidly through the LVN zone above $32,000 — exactly what LVN behavior predicts. Very little historical activity there, so price moved through quickly.
On the way up to new all-time highs, the old consolidation POC at $27,500 became a significant support level on the subsequent retest. Price bounced sharply from that zone — again, exactly what volume profile theory would predict.
I wasn’t actively trading Bitcoin at that time with significant size, but I used that period to study volume profile behavior in crypto extensively. The same principles apply. If anything, the patterns are sometimes cleaner in crypto because the retail-dominated nature of the market creates more pronounced volume concentrations.
Mistakes I Made Learning Volume Profile
Using too short a range.
Early on I would draw volume profiles over just a few days of data. The profiles were noisy and the levels weren’t meaningful. I’ve learned that meaningful profiles need enough data to show genuine volume concentrations — usually at minimum two to four weeks for swing trading, and at least a full session for day trading.
Treating every level as equally important.
Not all POCs are equal. A POC from a three-week consolidation on the daily chart carries far more weight than a POC from a two-hour period on the 15-minute chart. Context matters. Learn to weight your levels by the significance of the timeframe and range they come from.
Ignoring LVNs as targets.
For a long time I focused only on HVNs and the POC as support/resistance. I largely ignored LVNs. Once I started using LVNs as target zones — setting take profit just before the next HVN after an LVN — my risk-to-reward ratios improved noticeably.
Adding volume profile to cluttered charts.
I made the mistake of adding volume profile on top of charts already crowded with moving averages, RSI, MACD, and Bollinger Bands. You can’t read a volume profile properly when the chart is visual noise. Clean your chart first. Price, volume profile, and a few key horizontal levels — that’s all you need.
Expecting price to reverse exactly at levels.
Volume profile levels are zones, not precise price points. Price doesn’t always stop at the exact POC — sometimes it overshoots slightly before reversing. Give your levels a few pips or points of breathing room. Don’t set stops right at the level.
Not combining with price action.
Volume profile tells you where something significant might happen. Price action tells you when and how. A rejection candle forming at a volume profile POC is far more tradeable than just “price is at the POC.” Always wait for price action confirmation before entering.
Step-by-Step: Setting Up Volume Profile on TradingView
Step 1: Open TradingView and load your chart.
Step 2: Click the Indicators button at the top of the chart.
Step 3: Search “Volume Profile” — you’ll see several options. Select “Volume Profile Fixed Range” to start.
Step 4: Draw the profile over the range you want to analyze by clicking and dragging across the relevant candles.
Step 5: In the indicator settings, make sure “POC,” “Value Area High,” and “Value Area Low” are all enabled and visible.
Step 6: Adjust the “Row Size” setting to control how granular the profile is. I typically use 24 rows for daily charts and 48 rows for shorter timeframes.
Step 7: Add horizontal lines at the POC, VAH, and VAL with clear labels. This makes them easy to spot at a glance.
Step 8: Look for obvious HVNs and LVNs in the profile. Mark HVNs with shaded zones in one color and LVNs in another.
Step 9: Set price alerts at the POC and VAH/VAL levels.
Step 10: Add a second profile over a different range for additional context — a longer-range profile for the bigger picture alongside a shorter-range one for the current structure.
Tools for Volume Profile Trading
TradingView — the most accessible and user-friendly option. Has all the volume profile tools you need built in. Free version includes the Visible Range Volume Profile. Paid plans unlock more simultaneous indicators and additional profile types.
Sierra Chart — more advanced desktop platform used by professional traders. Highly customizable volume profile with more options than TradingView. Steeper learning curve but more powerful for serious volume analysis.
NinjaTrader — popular among futures traders in the US. Excellent volume profile tools, particularly for ES and NQ futures where volume profile is widely used.
Bookmap — specialized platform that shows volume and order flow in real time. More advanced than standard volume profile but gives you even deeper insight into where volume is accumulating.
For most traders starting with volume profile, TradingView is more than enough. Master the concepts there before considering more advanced platforms.
Volume Profile vs Standard Volume Indicator
I still use the standard volume indicator. Both have value — they just answer different questions.
Standard volume tells me: how active was the market during this time period?
High volume during a breakout confirms momentum. Low volume during a rally suggests weakness. Volume spikes often mark turning points. These are all useful observations.
Volume profile tells me: at which prices has the most activity occurred?
This gives me actionable support and resistance levels. It tells me where price is likely to slow down, where it might move quickly, and where it’s likely to gravitate back toward.
Using both together gives you a more complete picture. A breakout above a volume profile LVN on high standard volume is a much stronger signal than either observation alone.
The Shift That Volume Profile Creates
Before I learned volume profile, my chart analysis was essentially backward-looking in a surface-level way. I was looking at where price had been to predict where it might go.
Volume profile made that process deeper. I wasn’t just looking at where price had been — I was looking at where transactions had occurred, where participants had engaged, where large positions were likely built.
That shift from price-based to transaction-based analysis changes how confident you can be in your levels. A level that coincides with a major volume concentration isn’t just “price was there before.” It’s “real money changed hands there, and those participants may defend that level again.”
It doesn’t make trading easy. Nothing does. But it gives you a more solid foundation for the decisions you make — which, over hundreds of trades, is exactly what you need to tip the odds in your favor.
Frequently Asked Questions
What is Volume Profile trading book?
The most recommended book is “Mind Over Markets” by James Dalton — it covers Volume Profile and Market Profile concepts deeply. “Trading with Market Profile” is another solid choice for serious traders.
What is Volume Profile trading course?
A Volume Profile trading course teaches you how to identify POC, Value Area, HVNs and LVNs to find high-probability entries. TradingView and YouTube have free resources — paid courses on Udemy also cover it well.
What is Critical trading Volume Profile trading strategy?
The most critical strategy is trading rejections from the Point of Control and Value Area boundaries. When price returns to POC with a rejection candle — that’s your entry signal with clear stop and target.
What is Volume Profile indicator?
Volume Profile indicator is a chart tool available on TradingView and NinjaTrader that displays horizontal bars showing trading volume at each price level — helping traders identify support, resistance, and fast-move zones.
Disclaimer:
This article is for educational purposes only and does not constitute financial or investment advice. Trading involves significant risk of loss. Always conduct your own research and consider consulting a qualified financial advisor before making any trading decisions.

Hira Ch is a Forex trader and financial content writer specializing in gold, crypto, and currency markets.Based in Lahore, she breaks down complex trading
concepts into simple, actionable insights at ExpertJourny.