Best Trading Indicators for Beginners in 2026: How to Choose the Right Ones

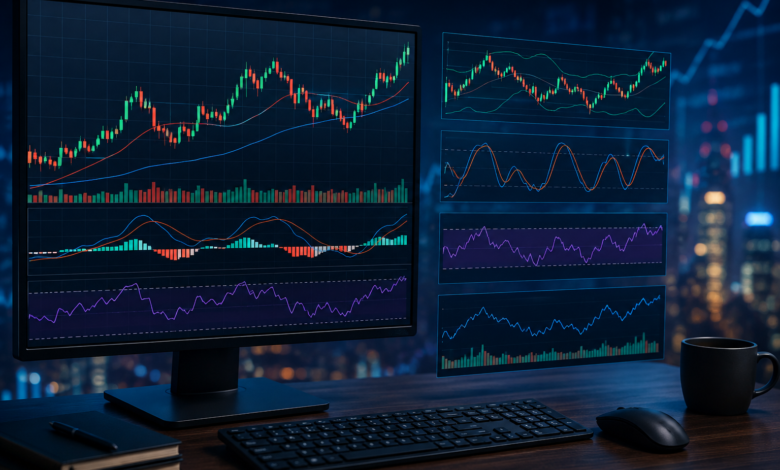
Best Trading Indicators for Beginners in 2026: How to Choose the Right Ones
Learning how to read financial markets can feel overwhelming when you first encounter technical analysis. Trading charts contain countless indicators, signals, patterns, and settings, making it difficult to know where to start.
The good news is that beginners do not need dozens of indicators to analyze a market.
A small selection of well-understood trading indicators can provide useful information about price trends, momentum, volatility, and market activity. The key is learning what each indicator measures and understanding when it may become less reliable.
In this guide, we explore some of the best trading indicators for beginners in 2026 and explain how traders can use them more effectively.
What Are Trading Indicators?
Trading indicators are mathematical tools that process market data such as price and trading volume.
They are commonly displayed directly on a chart or in a separate panel below the price chart.
Depending on the indicator, it may help traders analyze:
- Market trends
- Price momentum
- Volatility
- Trading volume
- Potential support and resistance areas
- Possible changes in market direction
Indicators do not predict the future with certainty. Instead, they help traders organize market information and develop a structured approach to analysis.
Why Beginners Should Avoid Too Many Indicators
One of the most common mistakes new traders make is adding too many indicators to a single chart.
A chart containing moving averages, RSI, MACD, Bollinger Bands, stochastic oscillators, multiple volume indicators, and other tools may look sophisticated. However, more indicators do not necessarily produce better decisions.
Several indicators can also provide similar information.
For example, using multiple trend-following indicators may simply confirm the same trend repeatedly without adding meaningful information.
A simpler setup can make it easier to understand what the market is doing.
1. Moving Averages
Moving averages are among the easiest technical indicators for beginners to understand.
A moving average calculates the average price over a selected number of periods. As new prices appear, the average changes.
Common examples include:
- 20-period moving average
- 50-period moving average
- 100-period moving average
- 200-period moving average
How Moving Averages Work
A moving average can help traders identify the general direction of a market.
When price consistently trades above a rising moving average, it may indicate that the market has upward momentum.
When price remains below a declining moving average, it may suggest weaker market conditions.
Traders also watch interactions between different moving averages.
For example, a shorter-term average crossing above a longer-term average may be interpreted as a potential bullish signal.
Advantages
Moving averages are:
- Easy to understand
- Useful for identifying trends
- Available on almost every trading platform
- Applicable to many markets
Limitation
Moving averages are based on historical prices, so they can react slowly when the market suddenly changes direction.
2. Relative Strength Index (RSI)
The Relative Strength Index, commonly called RSI, is a momentum indicator.
It generally moves between 0 and 100 and is designed to help traders evaluate the strength of recent price movements.
Traditionally, readings above 70 are considered an indication that an asset may be overbought, while readings below 30 are often considered oversold.
However, beginners should be careful with these levels.
An asset can remain above 70 during a strong uptrend or below 30 during a powerful downtrend.
How Beginners Can Use RSI
Rather than treating RSI as an automatic buy or sell signal, traders can use it alongside price action and trend analysis.
For example, an RSI reading near an extreme level may encourage a trader to investigate whether momentum is weakening.
RSI Advantages
- Easy to read
- Useful for momentum analysis
- Can highlight potential overbought or oversold conditions
- Can help identify momentum divergence
RSI Limitation
RSI can remain at extreme levels for extended periods during strong trends.
3. Moving Average Convergence Divergence (MACD)
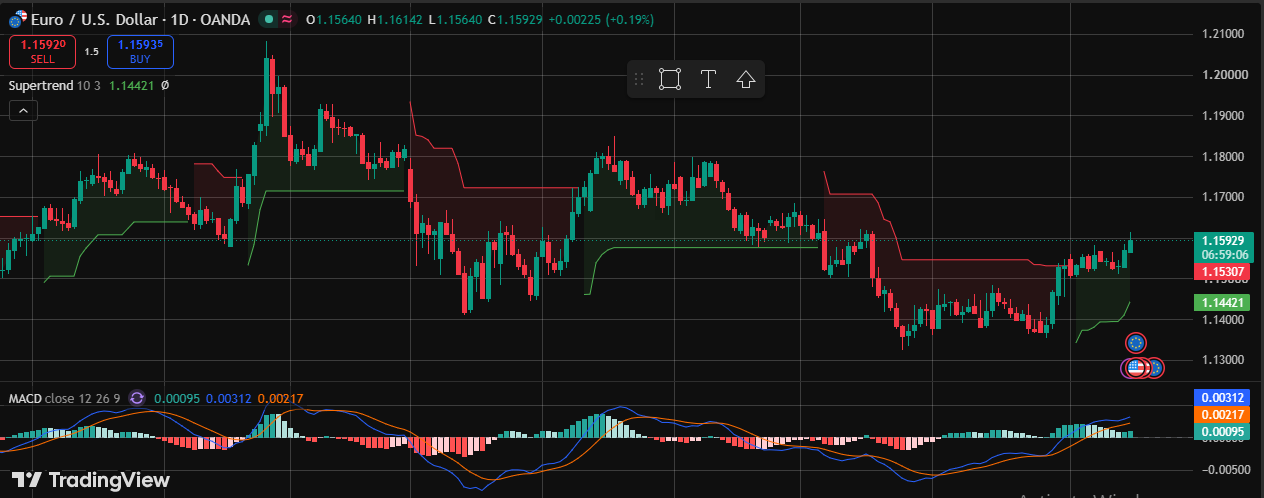
MACD is another popular momentum and trend-following indicator.
It compares different exponential moving averages to help traders analyze changes in momentum.
The indicator typically includes a MACD line, signal line, and histogram.
Why Traders Use MACD
Traders may look for:
- Crossovers
- Changes in momentum
- Divergence
- Potential trend transitions
When the MACD line crosses the signal line, some traders interpret the event as a possible change in momentum.
However, crossover signals can be delayed, particularly in rapidly changing markets.
MACD for Beginners
MACD can be useful once a beginner understands basic price trends and moving averages.
It is generally better to learn the underlying concept rather than simply buying or selling whenever two lines cross.
4. Bollinger Bands
Bollinger Bands are designed to provide information about price volatility.
The indicator generally consists of:
- A middle moving average
- An upper band
- A lower band
The distance between the bands changes according to market volatility.
When volatility increases, the bands can expand. When volatility decreases, they can move closer together.
What Is a Bollinger Band Squeeze?
A period when the bands become relatively narrow is often called a Bollinger Band squeeze.
Some traders watch these periods because reduced volatility can sometimes be followed by a larger price movement.
However, the indicator itself does not determine which direction the breakout will take.
Advantages
Bollinger Bands can help traders understand:
- Volatility
- Relative price position
- Potential breakout conditions
- Changes in market activity
Limitation
Price touching an upper or lower band does not automatically mean that a reversal will occur.
5. Volume Indicators
Price tells traders what an asset is doing, while volume can provide additional information about market participation.
Volume indicators can help traders examine how much trading activity is occurring during a particular period.
For example, a price breakout accompanied by significantly higher volume may attract more attention than a breakout occurring on unusually low volume.
Why Volume Matters
Volume can help traders investigate whether a price movement has strong participation behind it.
However, volume data differs between markets. Exchange-traded markets may provide more centralized volume information than decentralized markets such as spot forex.
How to Choose the Right Trading Indicators
The best indicator depends on what you are trying to analyze.
For Trend Analysis
Consider:
- Moving averages
- MACD
For Momentum Analysis
Consider:
- RSI
- MACD
For Volatility Analysis
Consider:
- Bollinger Bands
For Market Activity
Consider:
- Volume indicators
A beginner could start with one trend indicator and one momentum indicator instead of using five or six tools simultaneously.
A Simple Indicator Setup for Beginners
A simple chart might contain:
50-period moving average + RSI
The moving average can help provide information about the broader price trend, while RSI can provide additional momentum information.
For example, a trader might first determine whether the market is generally trending upward or downward using the moving average.
The RSI can then be used as an additional piece of information rather than as a standalone trading signal.
This approach can help beginners focus on understanding market behavior instead of searching for a perfect indicator.
Should You Use the Same Indicators for Every Market?
Not necessarily.
Different markets behave differently.
Stock markets, forex, cryptocurrencies, commodities, and futures can have different levels of volatility, liquidity, trading hours, and fundamental drivers.
An indicator setting that works reasonably well in one market may perform poorly in another.
This is why traders should test their approach using historical data and, where appropriate, a demo account before risking real money.
Common Mistakes When Using Trading Indicators
Mistake 1: Treating Indicators as Predictions
Indicators analyze existing market data. They do not know what will happen next.
A bullish indicator reading does not guarantee that price will rise.
Mistake 2: Using Too Many Indicators
More signals can create more confusion.
A small group of complementary tools is often easier to interpret.
Mistake 3: Ignoring Price Action
Indicators are derived from market data. They should not completely replace analysis of price structure, support, resistance, and market conditions.
Mistake 4: Changing Settings Constantly
Beginners sometimes change indicator settings whenever a trade fails.
This can lead to overfitting and inconsistent decision-making.
Mistake 5: Ignoring Risk Management
Even an effective technical setup can produce losing trades.
Position sizing, stop-loss planning, and risk control are therefore important parts of a trading strategy.
Can Trading Indicators Work Without a Strategy?
Indicators are tools, not complete strategies.
For example, knowing that RSI is below 30 does not automatically tell you whether you should buy an asset.
A complete trading plan may consider:
- Market trend
- Price structure
- Indicator signals
- Entry conditions
- Stop-loss placement
- Profit target
- Position size
- Maximum acceptable risk
Combining these elements creates a more structured approach than relying on a single indicator.
How Beginners Can Learn Technical Indicators
The best way to learn an indicator is to understand its purpose before using it with real money.
Start by learning one indicator at a time.
Study how it behaves during:
- Strong uptrends
- Strong downtrends
- Sideways markets
- High-volatility periods
- Low-volatility periods
Then review historical charts and observe how the indicator reacted to different market conditions.
Keeping a trading journal can also help identify which signals are useful and which ones repeatedly produce poor results.
Final Thoughts
The best trading indicators for beginners are not necessarily the most complicated ones.
Moving averages can help identify trends, RSI can provide momentum information, MACD can help analyze trend and momentum changes, Bollinger Bands can provide insight into volatility, and volume indicators can show changes in market participation.
The most important lesson is to understand what an indicator can and cannot tell you.
Instead of searching for a perfect indicator, beginners should focus on building a simple trading process, testing their ideas, managing risk, and learning how different indicators behave under different market conditions.
Technical indicators can support better analysis, but successful trading requires much more than a collection of signals.