I still remember the first time I plotted the Supertrend indicator on a EUR/USD chart back when I was still figuring out why my trades kept getting stopped out five minutes before the “real” move started. I was tired of moving averages lagging behind price like a slow uncle at a wedding, always arriving after everything interesting already happened.
A trading buddy of mine, over chai at his place, told me to try Supertrend. He said it was simple, visual, and didn’t need a PhD to read. I was skeptical. Every indicator promises that.
I plotted it that night. Green line under price, red line above price, and a clean flip whenever the trend changed direction. No confusing histograms, no squinting at crossovers. Within a week I was hooked, not because it made me rich overnight, but because it finally gave me a visual anchor for trend direction that I could explain to a beginner in thirty seconds.
That’s what this article is really about. Not textbook theory, but what actually happens when you put Supertrend on a live chart and start clicking buy and sell with real money on the line.
Key Takeaways
- Supertrend is a trend-following indicator built on ATR (Average True Range), so it adapts to volatility instead of using a fixed distance like simple moving averages.
- It works best in trending markets and struggles badly in sideways, choppy conditions — this single fact causes most beginner losses.
- The two settings that matter most are the ATR period (commonly 10) and the multiplier (commonly 3), and changing them changes how sensitive your signals are.
- Combining Supertrend with a volume filter or a higher timeframe trend check reduces false signals significantly.
- No indicator, including Supertrend, works alone — risk management and position sizing decide whether you survive long enough to let it work.
What Exactly Is the Supertrend Indicator (And Why Traders Actually Use It)
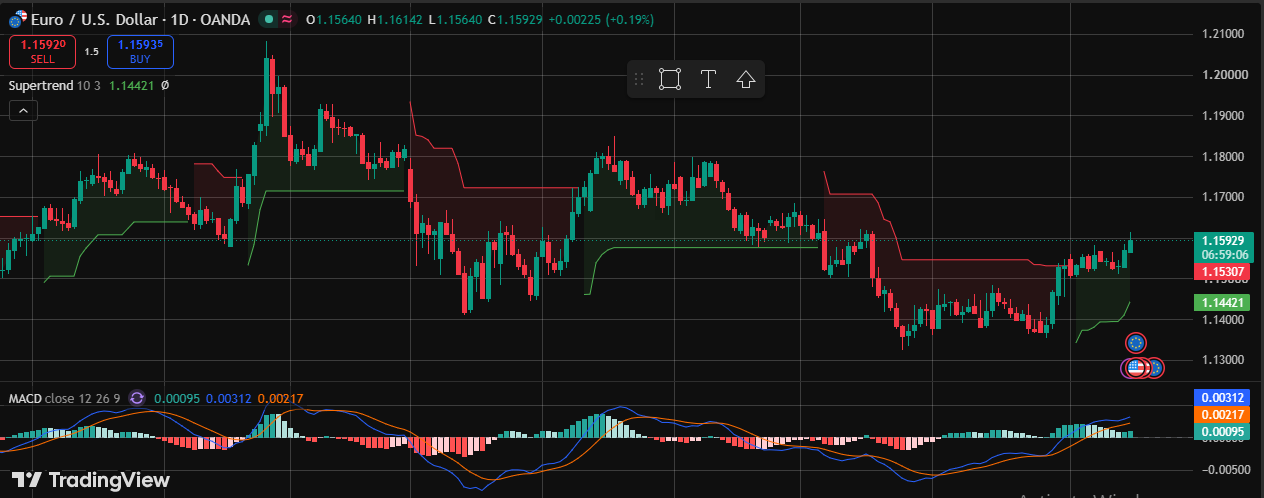
Supertrend sits directly on your price chart as a single line that flips between green and red. When price closes above the line, it turns green and sits below price, telling you the trend is up. When price closes below the line, it turns red and sits above price, telling you the trend is down.
What makes it different from a simple moving average is the ATR component baked into its formula. ATR measures how much an asset typically moves in a given period, so the indicator automatically widens or tightens its distance from price depending on current volatility. During calm markets, the line stays closer to price. During wild sessions, like news events on Forex Factory‘s calendar, it gives price more breathing room.
I’ve used this on everything from Nifty futures to Bitcoin on Binance, and honestly, the core logic holds up across asset classes because volatility-based indicators don’t care whether you’re trading currencies, indices, or crypto. They only care about price behavior.
The reason traders love it comes down to simplicity. You don’t need to interpret oscillator divergences or count waves. The line either flips or it doesn’t. That clarity is exactly why so many beginners get pulled toward Supertrend as their first “real” indicator, and also why so many misuse it without understanding its limitations.
How Supertrend Is Calculated (Without the Boring Math Lecture)
I’m not going to pretend the formula matters much for day-to-day trading, but understanding it helps you trust the signals instead of treating the indicator like a magic black box.
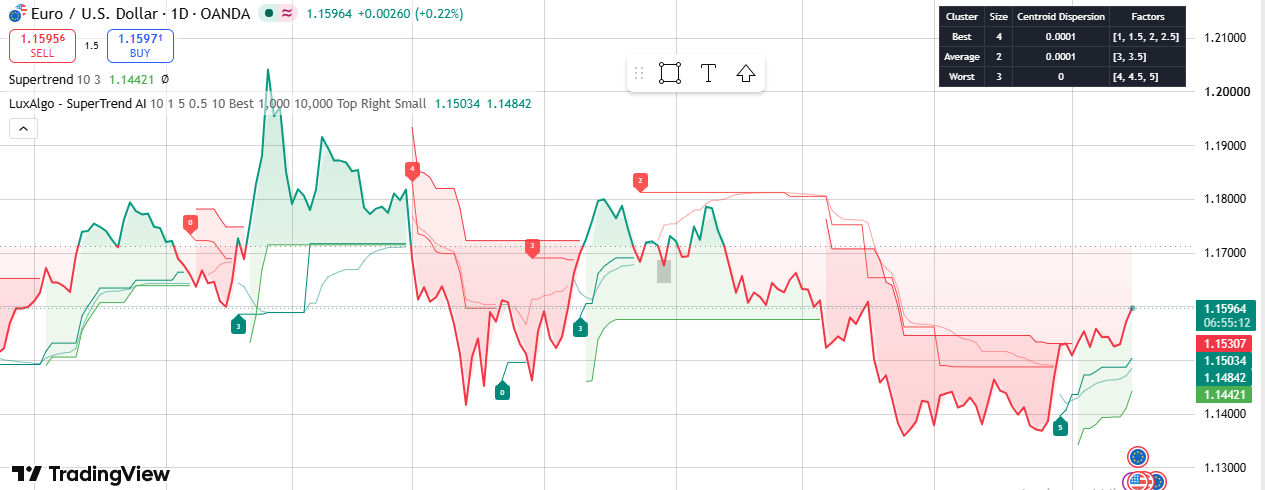
Supertrend uses two components: the ATR value and a multiplier. The basic upper and lower bands get calculated using the average of high and low prices, then adjusted by multiplying ATR by your chosen multiplier. As price moves, the bands trail behind it, flipping sides whenever price closes beyond the current band.
Because ATR updates constantly, the bands aren’t static. This is the exact reason Supertrend behaves differently than a fixed-percentage trailing stop. During a low-volatility grind, like EUR/CHF on a quiet Tuesday, the bands stay tight. During a breakout, like Gold spiking after an FOMC announcement, the bands widen automatically to avoid getting whipsawed by the initial volatility spike.
You don’t need to calculate this by hand. Every platform, TradingView, MetaTrader 4, MetaTrader 5, even most crypto exchanges like Bybit, has it built in as a free indicator. Just search “Supertrend” in the indicator library and drag it onto your chart.
Best Settings I’ve Actually Used in Live Trading
The default settings on most platforms are ATR period 10 and multiplier 3. Honestly, for years I didn’t touch these because I assumed the defaults were “optimized” by someone smarter than me.
Then I started backtesting manually on TradingView’s replay feature, and I noticed something. On lower timeframes, like the 5-minute or 15-minute chart, the default multiplier of 3 produced way too many false flips during London session opens. Price would spike, flip the trend, then reverse right back within a few candles.
I switched to a multiplier of 2 for scalping setups and it reduced whipsaws noticeably, though it also meant catching trends slightly later. For swing trading on the 4-hour or daily chart, I actually increased the multiplier to 4, sometimes even 5, because I wanted fewer signals and stronger conviction on each one.
There’s no universal “best” setting here, and any blog claiming otherwise is not being honest with you. What I can tell you is this: lower multipliers mean more signals and more noise, higher multipliers mean fewer signals and smoother trends but later entries. Test both on your specific market before committing real capital.
Which Timeframes and Markets Work Best with Supertrend
I’ve traded Supertrend across forex majors, indices, and crypto, and the pattern is consistent. It performs best on trending, liquid instruments during active trading hours.
On forex pairs like GBP/USD or USD/JPY during London-New York overlap, Supertrend catches strong directional moves well because volatility and volume support sustained trends. On thin, low-volume pairs during Asian session, it chops constantly and generates signals that reverse almost immediately.
Crypto is interesting because Bitcoin and Ethereum trend hard when they trend, then chop sideways for days. I learned this the expensive way, taking Supertrend signals during a three-day sideways grind on ETH/USDT and getting stopped out four times in a row. The indicator wasn’t broken. The market simply wasn’t trending, and no trend indicator works in a non-trending market.
Higher timeframes generally produce more reliable signals because they filter out intraday noise. If you’re newer to trading, I’d genuinely recommend starting with the daily or 4-hour chart before dropping down to 15-minute scalping setups, where false signals happen far more often.
Combining Supertrend With Other Indicators (What Actually Works)
Using Supertrend alone is like driving with only a rearview mirror. It tells you direction, but it doesn’t tell you strength or confirm momentum.
I personally pair it with a volume indicator. When Supertrend flips green and volume spikes above its recent average, that’s a much stronger signal than a flip on dead volume. This single filter cut down a huge chunk of my false signals during choppy sessions.
Some traders combine it with RSI to avoid entering trades when the market is already overbought or oversold at the moment of the flip. Others check a higher timeframe Supertrend first, only taking 15-minute signals that align with the 1-hour trend direction. I do a version of this myself, and it’s probably the single change that improved my win rate the most over the years.
Moving averages work well too. A simple 50 EMA as a trend filter, only taking green Supertrend signals when price sits above the 50 EMA, adds another layer of confirmation without overcomplicating your chart. The goal isn’t stacking ten indicators. It’s adding one or two that answer questions Supertrend can’t answer on its own, like momentum strength or overall market structure.
Pros and Cons of Supertrend Indicator
Pros
- Visually simple, even complete beginners can read the green/red flip without confusion
- Adapts to volatility automatically through ATR, unlike fixed-distance trailing stops
- Works across multiple asset classes including forex, indices, and crypto
- Doubles as both an entry signal and a trailing stop-loss reference
- Available free on almost every major platform, including TradingView and MetaTrader
Cons
- Generates frequent false signals in sideways or low-volatility markets
- Lags at the exact moment of trend reversal since it’s calculated from past price data
- Beginners often over-rely on it without checking market context or higher timeframe trend
- Default settings aren’t optimized for every market or timeframe, requiring manual testing
- Can encourage overtrading on lower timeframes due to frequent line flips
Step-by-Step: How I Set Up and Trade Supertrend on TradingView
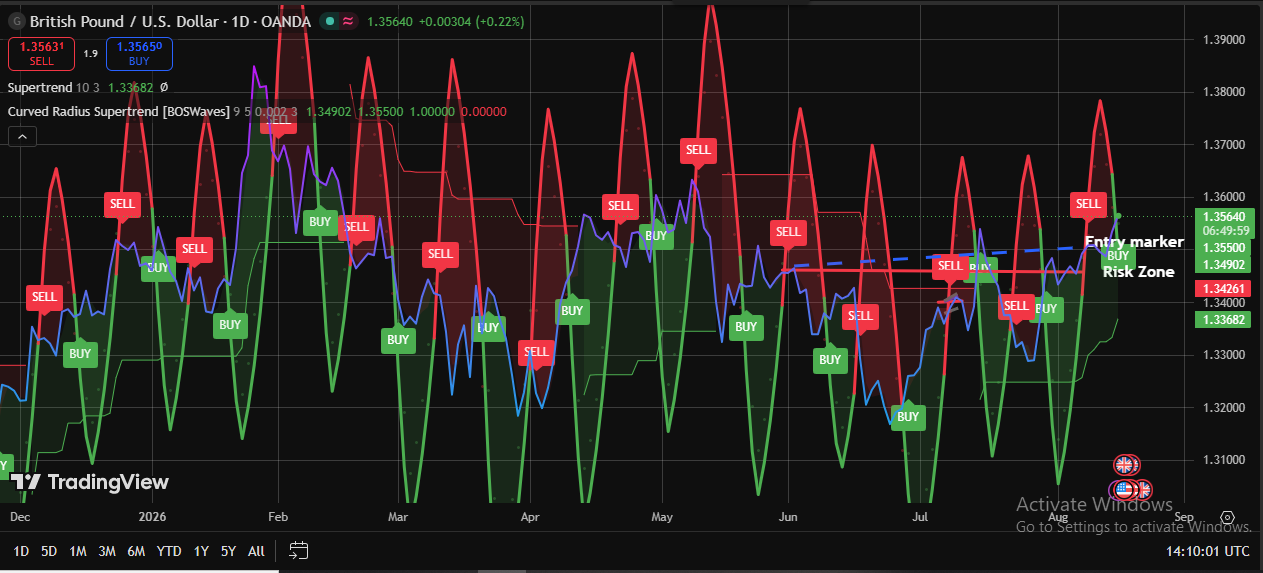
Step 1: Add the indicator. Open TradingView, click “Indicators,” search “Supertrend,” and add it to your chart. It’s free and doesn’t require a premium subscription.
Step 2: Set your parameters. Start with ATR period 10 and multiplier 3 as your baseline. Adjust based on your timeframe as I described earlier, lower multiplier for scalping, higher for swing trading.
Step 3: Choose your timeframe based on your trading style. Daily or 4-hour for swing trades, 15-minute or 1-hour for intraday trades. Avoid anything below 5-minute unless you’re an experienced scalper with tight risk control.
Step 4: Wait for a confirmed flip. Don’t enter the moment you see color change mid-candle. Wait for candle close to confirm the flip actually held, especially on lower timeframes where wicks can trigger false flips.
Step 5: Add a confirmation filter. Check volume, RSI, or a higher timeframe trend before entering. This single habit separates consistent Supertrend users from people who blindly follow every flip.
Step 6: Place your stop-loss near the Supertrend line itself. This is one of its underrated uses, the line acts as a natural trailing stop that adjusts with volatility.
Step 7: Manage the trade as the line trails. As price moves favorably, the Supertrend line trails behind it. Many traders exit when the line flips color again, locking in the trend-following profit rather than guessing tops or bottoms.
Step 8: Journal the trade. Note your entry reason, exit reason, and outcome. Over time this data tells you which settings and markets actually work for your style, instead of guessing.
Mistakes to Avoid With Supertrend (I’ve Made Most of These)
Trading every single flip blindly. Early on, I took every green and red flip without question. My win rate during sideways markets was embarrassing. Not every flip deserves a trade.
Ignoring market structure. Supertrend doesn’t know about support, resistance, or major news events. I once held a Supertrend buy signal straight into a central bank announcement and watched it reverse violently within minutes. Always check your economic calendar.
Using the same settings across every market. I made this mistake for almost two years, using default settings on everything from forex to crypto to indices, then wondering why results were inconsistent. Different markets have different volatility profiles.
Skipping the confirmation candle close. Entering mid-candle on an unconfirmed flip burned me repeatedly, especially during volatile news spikes where wicks pierce the line and immediately reverse.
No stop-loss beyond the indicator itself. Relying purely on the flip to exit, without a hard stop-loss in place, exposed me to bigger losses during fast-moving sessions before the line could catch up. Always define your maximum risk before entering, regardless of what the indicator says.
Overtrading on low timeframes. The 1-minute and 5-minute charts flip constantly. I chased these signals for months thinking more trades meant more profit. It meant more commissions and more stress, not more profit.
Final Thoughts
Supertrend earned its permanent spot on my charts, but not because it’s some secret formula that prints money. It earned that spot because it gives me a clean, visual read on trend direction without cluttering my screen with noise.
The traders who struggle with it usually aren’t using a “broken” indicator. They’re using it in the wrong market conditions, on the wrong timeframe, without any confirmation or risk management around it. Fix those three things, and Supertrend becomes a genuinely useful tool in your trading toolkit rather than another indicator gathering dust after a few losing trades.
Test it on a demo account first. Watch how it behaves during trending weeks versus choppy weeks. Once you see that difference with your own eyes, you’ll understand exactly when to trust it and when to leave it alone.
Frequently Asked Questions
vHow do I use the supertrend indicator?
Add it to your chart and follow the flips — buy when the line turns green below price, sell when it turns red above price. Always wait for candle close to confirm before entering.
What is 10 and 3 in Supertrend?
10 is the ATR period, which measures average volatility over the last 10 candles. 3 is the multiplier applied to that ATR value to set how far the band sits from price.
How to confirm supertrend indicator?
Wait for a candle to close beyond the line, not just touch it with a wick. Pairing the flip with volume or a higher timeframe trend check makes the confirmation much stronger.
How to calculate supertrend indicator?
It’s calculated by taking the average of high and low prices, then adding or subtracting ATR multiplied by the chosen multiplier to form upper and lower bands. These bands trail price and flip sides whenever price closes past the current band.
Disclaimer:
This article is for educational purposes only and does not constitute financial or investment advice. Trading forex, crypto, and other financial instruments involves substantial risk of loss and is not suitable for every investor.

Hira Ch is a Forex trader and financial content writer specializing in gold, crypto, and currency markets.Based in Lahore, she breaks down complex trading
concepts into simple, actionable insights at ExpertJourny.