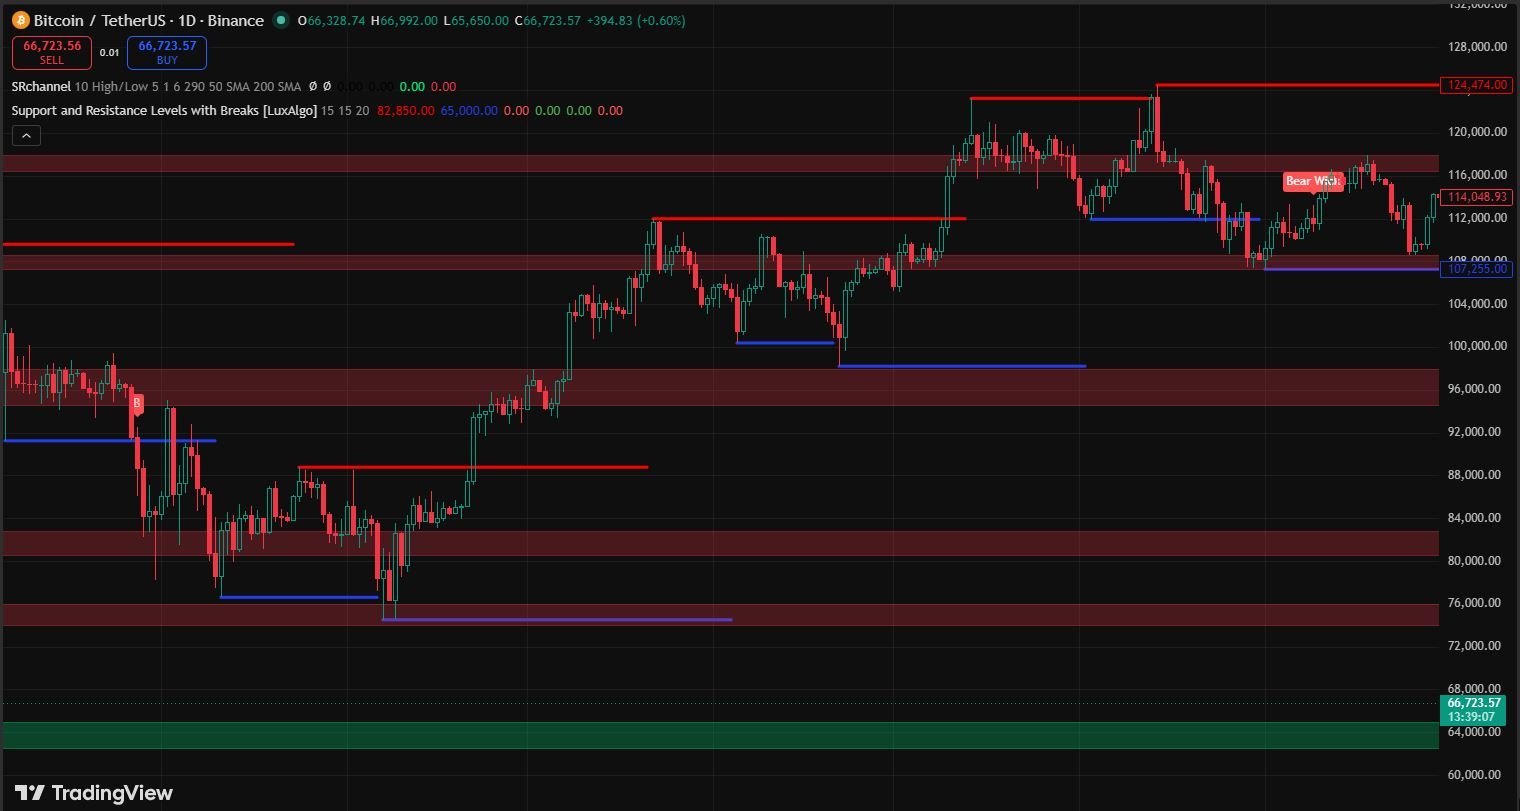
Support Resistance Indicator.For the first eight months of my trading life, I drew support and resistance levels by hand.
Every evening I’d sit down, open TradingView, and spend 20-30 minutes manually marking levels on five or six charts. I was proud of it honestly. Felt like real analysis. Like I was doing the work.
The problem was — my levels were wrong. Not always. But often enough to hurt.
I’d mark a support level at 1.0850 and price would bounce from 1.0832. I’d mark resistance at 1.1200 and price would reverse at 1.1218. Close enough to be confusing, but not close enough to keep me in trades.
My entries were off. My stops were placed wrong because my levels were wrong. And I genuinely couldn’t figure out what I was missing.
Then a trader in a Discord group I was part of shared his chart. Clean. Precise. Levels sitting exactly where price was reacting. No manual lines — just an indicator doing the work automatically and doing it better than I had been doing manually.
He was using a support resistance indicator.
I spent that whole weekend learning everything about it. And within two weeks of using it properly, my entry accuracy improved noticeably. Not because I’d found some magic tool — but because the indicator was identifying levels more precisely and consistently than my tired eyes were doing at 11 PM every night.
Let me tell you everything I’ve learned about support resistance indicators — how they work, how to use them, and the mistakes I made so you don’t have to repeat them.
What a Support Resistance Indicator Actually Does
Before getting into the how, let me explain the what — because there’s a misconception I had early on that I want to clear up.
A support resistance indicator doesn’t predict the future. It doesn’t tell you where price will go. What it does is identify price levels where the market has historically shown significant reaction — bounces, reversals, consolidations — and marks those levels automatically on your chart.
The logic is simple: if price reacted strongly at a certain level multiple times in the past, it’s likely to react there again in the future. The indicator finds those levels by analyzing historical price data — looking for areas where price repeatedly touched, reversed, or consolidated.
That consistency is what I was missing when I drew levels manually. Some days I was careful and precise. Other days I was rushing and sloppy. The indicator doesn’t have bad days.
The Different Types of Support Resistance Indicators
Pivot Point Based Indicators
Pivot points are calculated mathematically from the previous period’s high, low, and closing price. Classic pivot points give you a central pivot level plus three support levels below and three resistance levels above.
These are popular among day traders because they reset daily — giving fresh levels every session. Forex traders particularly like weekly and monthly pivots for swing trading.
On TradingView the built-in Pivot Points indicator is free and clean. I use it on the daily chart to identify key weekly levels before each trading week begins.
Fractal Based Indicators
These identify swing highs and swing lows — points where price reversed direction — and mark those as support and resistance levels. The logic is that a level where price reversed before is likely to cause reaction again.
Bill Williams’ Fractal indicator is the classic version. There are more sophisticated versions on TradingView that connect fractal highs and lows into horizontal zones rather than just dots on the chart.
Volume Profile Based Indicators
These identify price levels where the most trading volume occurred. The theory is that high-volume areas represent strong agreement between buyers and sellers — and price tends to return to these areas.
The Volume Profile indicator on TradingView shows a horizontal histogram on the chart representing volume at each price level. The Point of Control — the level with the highest volume — is often one of the most powerful support/resistance levels on any chart.
This is the type I use most heavily now. Volume doesn’t lie. Where there was volume, there was real market participation — and those levels matter.
Zone Based Indicators
Instead of single lines, these draw zones — rectangular areas representing a range of prices where support or resistance has historically been strong. These are more realistic because support and resistance in real markets is rarely a precise single price — it’s a zone.
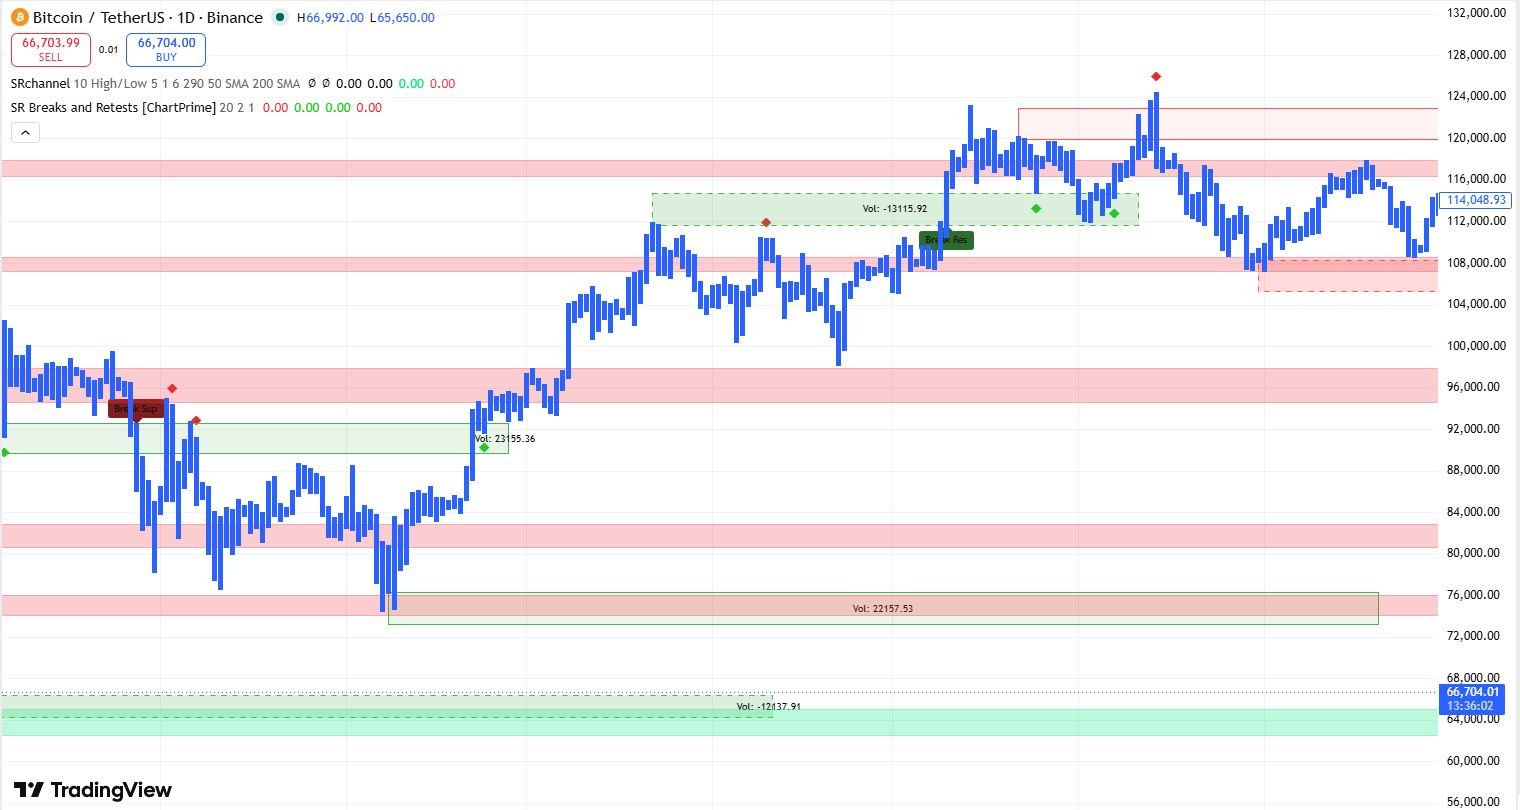
How I Actually Use Support Resistance Indicators — My Real Process
Morning routine — before the session opens:
I open TradingView and check four charts: EUR/USD, GBP/USD, Gold, and Bitcoin. On each chart I have two indicators running — the Pivot Points indicator set to weekly and the Volume Profile for the visible range.
I spend about five minutes per chart. I’m looking for three things:
Where are the key weekly pivot levels sitting? Where does the volume profile show the highest concentration of volume? Do any pivot levels coincide with high-volume zones?
When a pivot level sits inside a high-volume zone, that’s a confluence area. Price reacts at these points more reliably than at either signal alone.
I mark these confluence zones with a rectangle on the chart. These are my key levels for the week.
During the session:
I don’t watch charts constantly. I set price alerts on TradingView at my key levels. When price approaches a level, the alert fires and I check the chart.
When price reaches a key level, I drop to a lower timeframe — usually the 15-minute chart — and look for a candlestick confirmation. A strong rejection candle — hammer, shooting star, engulfing — at the key level is my entry signal.
Without that confirmation, I don’t enter. The level alone isn’t enough. The level tells me where to watch. The candlestick tells me when to act.
Setting Up the Best Support Resistance Indicator on TradingView
1: Open TradingView and go to EUR/USD daily chart.
2: Click Indicators → search “Pivot Points Standard” → add it. Change Type to “Weekly” for swing trading.
3: Indicators → search “Volume Profile Visible Range” → add it. The Point of Control — longest bar on histogram — mark it with a horizontal line.
4: Indicators → search “Support Resistance” → filter by community scripts. Look for high-rated ones with many users.
5: Right click on any key level → Add Alert → set it to trigger when price crosses the level.
A Real Trade Using Support Resistance Indicator
Let me walk you through a specific trade I took on GBP/USD about three months ago.
It was a Monday morning. My weekly analysis showed a strong high-volume zone between 1.2580 and 1.2620 on the daily chart. The weekly pivot P level sat at 1.2595 — right in the middle of that zone.
Strong confluence. I marked the zone and set an alert at 1.2625.
Tuesday afternoon my alert fired. Price had pulled back and was approaching the top of my support zone at 1.2620.
I dropped to the 15-minute chart and watched. Price entered the zone, slowed down, and formed a clear bullish engulfing candle right at 1.2588.
Entry: 1.2592. Stop: 1.2555 — below the zone. Target: 1.2720 — next weekly resistance.
Price moved up steadily over the next two days, hitting 1.2718 where I exited.
126 pips. Clean trade from start to finish.
What made it work: the indicator identified the zone automatically, volume profile confirmed it, and I waited for candlestick confirmation before entering. Three layers of confluence. Not a guess.
Honest Comparison — Best Support Resistance Indicators
TradingView’s Built-in Pivot Points
Pros: Free, accurate, updates automatically, multiple calculation methods.
Cons: Gives lines not zones, can feel cluttered with all levels showing.
Best for: Day traders who want clean daily/weekly reference levels.
Volume Profile Visible Range
Pros: Based on actual market activity — shows where real trading happened.
Cons: Changes as you scroll — takes time to learn properly.
Best for: Swing traders looking for high-confluence areas.
Auto Support and Resistance Scripts (Community)
Pros: Automated, saves time, consistent level identification.
Cons: Quality varies — some repaint, making them useless for trading.
Best for: Traders wanting a starting point they then filter manually.
Supply and Demand Zone Indicators
Pros: Identifies higher-probability zones, not just historical swing points.
Cons: More complex to use correctly.
Best for: Intermediate to advanced traders comfortable with institutional concepts.
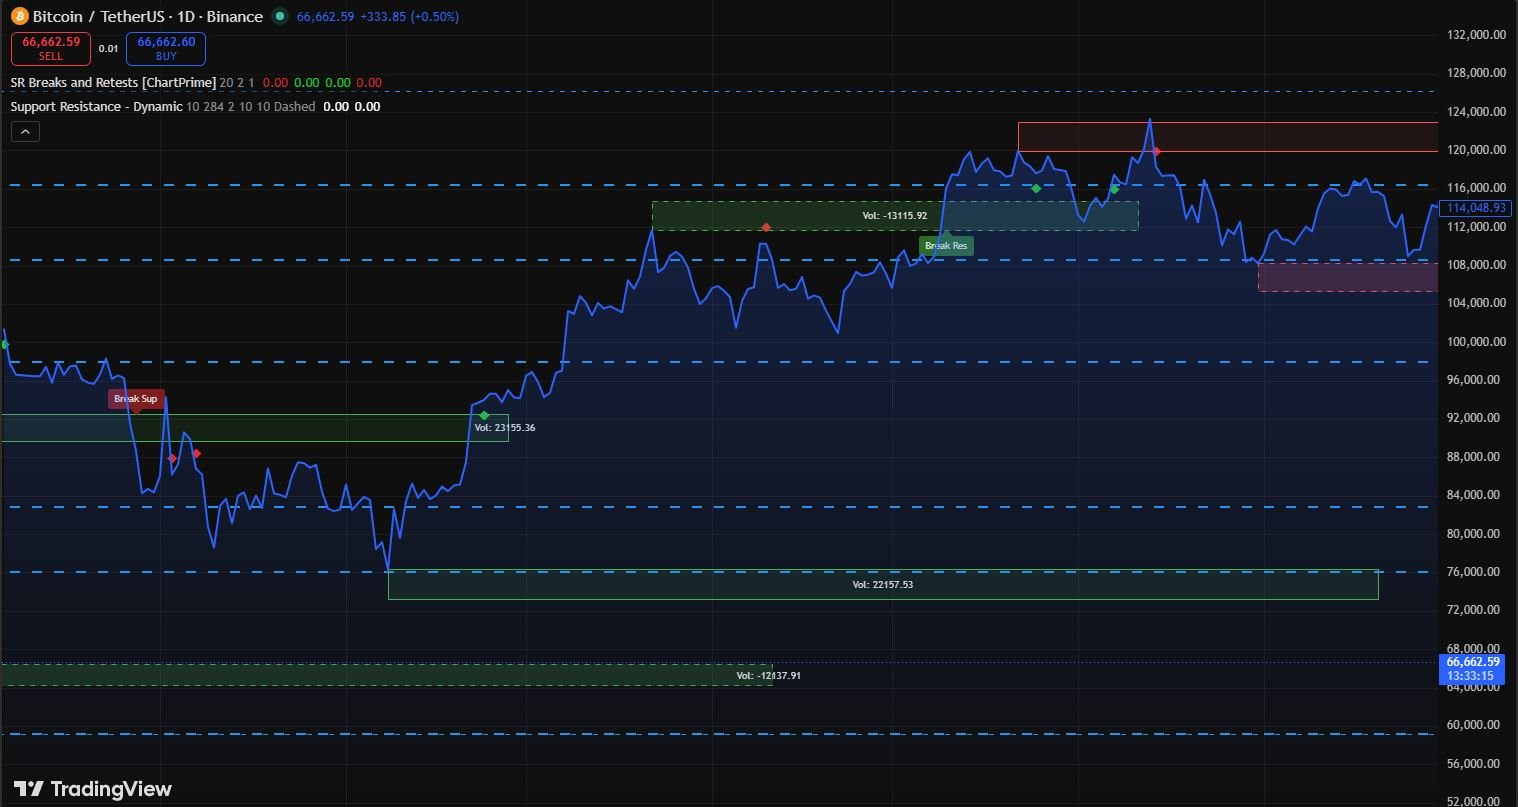
Mistakes I Made With Support Resistance Indicators
Treating every level as equally important.
The indicator draws many levels — not all matter equally. Focus only on levels that appear on multiple timeframes, have volume confluence, or have been tested multiple times.
Using it on too low a timeframe.
Support and resistance on a 1-minute chart is noise. I now use indicators on 1-hour charts minimum, and prefer daily and weekly for primary level identification.
Ignoring the broader trend.
A support level in a strong downtrend will break. In downtrends, support levels fail — that’s what downtrends do. Always check the bigger picture before relying on any support level.
Entering before price reaches the level.
I’d see price approaching from a distance and enter early. Set an alert. Walk away. Only look when price is actually at the level.
Confusing a line for a zone.
Support and resistance is not a precise single pip — it’s an area. When indicator draws a line at 1.0850, treat it as center of a zone — maybe 10-15 pips wide. Price doesn’t have to hit the exact line.
Not checking if community scripts repaint.
Some scripts change historical levels as new data comes in — completely useless for trading. Always check TradingView forums before trusting any community script.
How Support Resistance Works With SMC and Fibonacci
Support resistance indicators don’t replace your existing strategy — they enhance it.
If you trade Smart Money Concepts, indicator zones often align with order blocks. When they do — high conviction area.
If you trade Fibonacci, key Fibonacci levels often sit near strong support/resistance zones. When your 61.8% level sits inside a strong zone identified by the indicator — probability of that level holding increases significantly.
Think of the support resistance indicator as your level-finder. Your entry strategy tells you when to act. The indicator tells you where to focus your attention.
Step by Step — How to Start Using This Today
1: Open TradingView. Go to EUR/USD daily chart.
2: Add Pivot Points Standard — set to Weekly.
3: Add Volume Profile Visible Range. Find the Point of Control.
4: Look for where a pivot level and POC are close together. Mark that area with a rectangle.
5: Set a price alert just above and below that zone.
6: When alert fires, drop to 1-hour chart. Wait for rejection candle at the zone.
7: Clear rejection candle — hammer, engulfing, shooting star — that’s your entry signal.
8: Stop below the zone for longs, above for shorts. Target the next key level.
9: Log the trade in your journal — zone, entry, stop, target, outcome.
10: After 20 trades, review. Which zones worked best? Use that data to refine your approach.
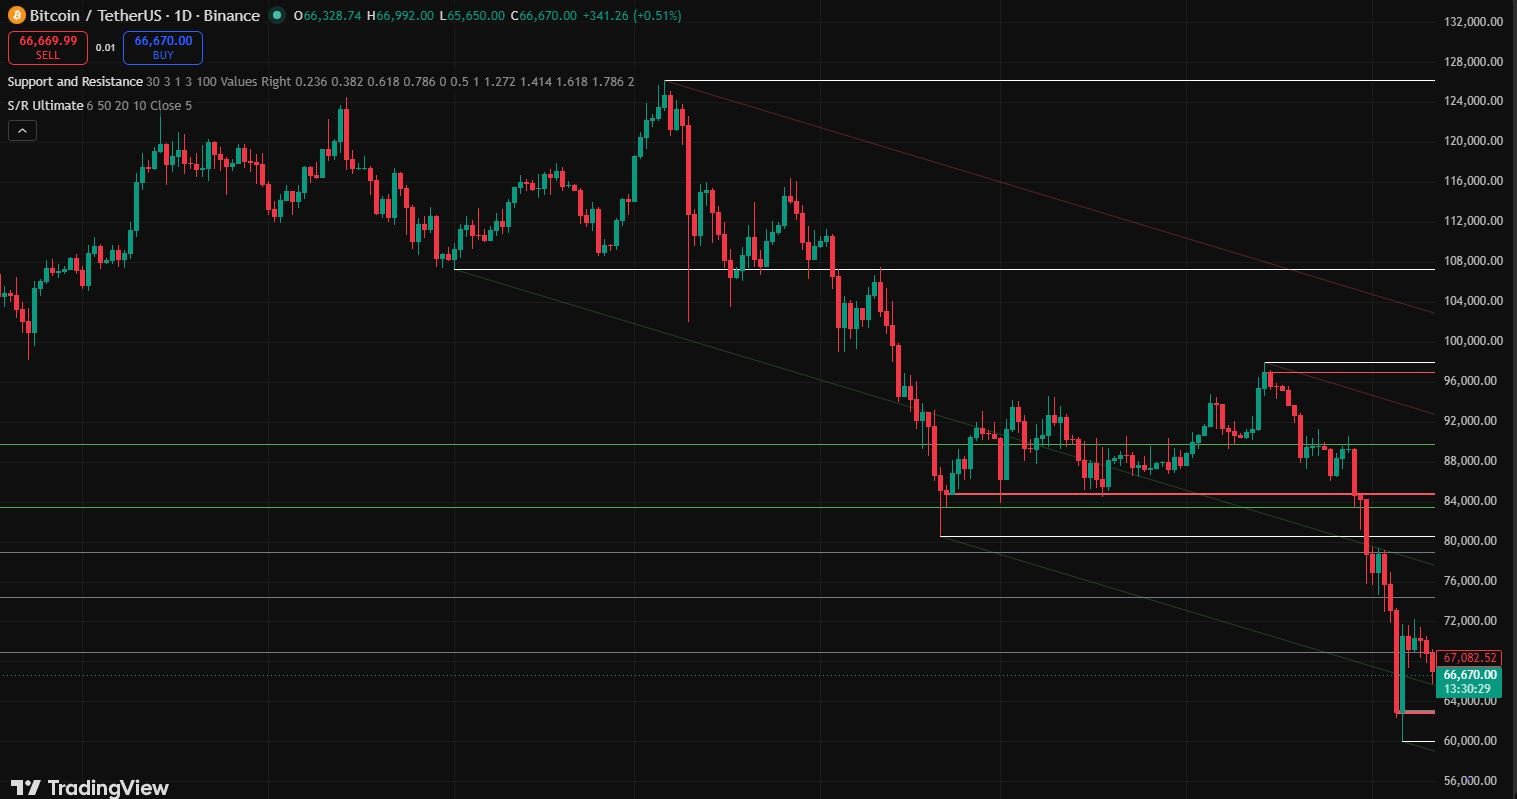
The Shift That Changed My Trading
Before I used support resistance indicators, I was making decisions based on approximate levels. After, I was making decisions based on precise, consistently identified zones with volume confirmation.
The difference wasn’t dramatic overnight. It was gradual. But over three or four months, my entry accuracy improved, my stop placements became more logical, and I stopped getting frustrated by “price almost hit my level.”
The indicator didn’t make me a better trader by itself. It removed one source of inconsistency — sloppy manual level drawing — and replaced it with something systematic.
Good tools don’t make decisions for you. They remove the noise so you can make better decisions yourself.
If you’re still drawing all your levels manually and struggling with consistency — try this for one month. Set up the indicators exactly as described. Use them on daily and weekly charts first.
I think you’ll be surprised by the difference precision makes.
Frequently Asked Questions
What is the best indicator for support and resistance?
Volume Profile and Pivot Points combination is the most reliable. Volume Profile shows where real trading happened, while Pivot Points give mathematically calculated levels — together they create high-confluence zones.
What is R1, R2, R3, and S1, S2, and S3?
These are Pivot Point levels — R1, R2, R3 are resistance levels above the central pivot, and S1, S2, S3 are support levels below it. They reset daily or weekly and show where price is likely to react.
How do support/resistance indicators work?
They analyze historical price data and automatically mark levels where price has repeatedly bounced, reversed, or consolidated. Instead of drawing levels manually, the indicator does it consistently without bias or fatigue.
What indicators confirm support?
Volume Profile, RSI divergence, and candlestick rejection patterns confirm support best. When a support level has high volume confluence and a hammer or engulfing candle forms there — that’s strong confirmation.
Disclaimer:
This article is for educational purposes only and does not constitute financial or investment advice. Trading involves significant risk of loss. Always conduct your own research and consider consulting a qualified financial advisor before making any trading decisions.

Hira Ch is a Forex trader and financial content writer specializing in gold, crypto, and currency markets.Based in Lahore, she breaks down complex trading
concepts into simple, actionable insights at ExpertJourny.