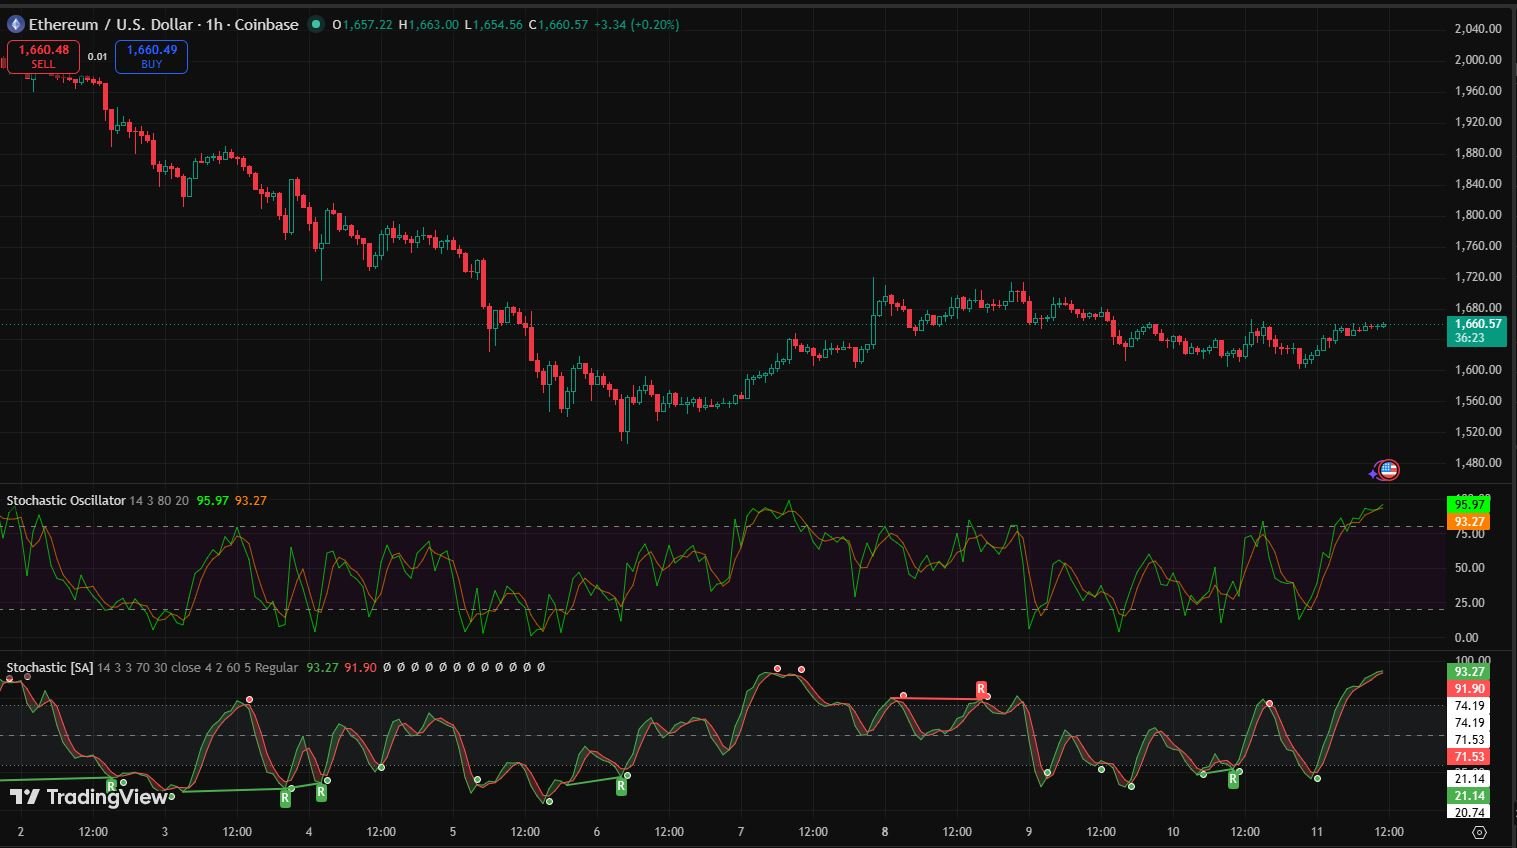
How to Read Stochastic Oscillator.I spent three months convinced the stochastic oscillator was broken.
Not broken like a software glitch. Broken like — it keeps telling me to buy and the price keeps dropping. It keeps flashing overbought and the price keeps climbing another 200 pips before reversing.
I’d added it to my charts because I’d seen a YouTube video where someone made it look effortless. Stochastic crosses up from oversold zone — buy. Crosses down from overbought — sell. Easy money, right?
Wrong.
My first two months using it were genuinely painful. I was taking losses on setups that looked perfect on paper. The indicator would give a clear signal, I’d enter, and the market would just laugh at me and keep moving in the opposite direction.
I almost deleted it permanently and went back to just price action.
What stopped me was a conversation with a trader I respected who said something that reframed everything: “The stochastic doesn’t tell you what to do. It tells you where you are. What you do with that information is your job.”
That one sentence changed how I used the indicator entirely. And over the following months, as I actually understood what the stochastic was measuring — not just what the lines were doing — it became one of the tools I rely on most.
Let me explain it the way I wish someone had explained it to me before I wasted those three months.
What the Stochastic Oscillator Is Actually Measuring
Before you can read an indicator properly, you need to understand what it’s actually calculating. Most traders skip this step. They just watch the lines and react. That’s why most traders misuse it.
The stochastic oscillator measures where the current closing price sits relative to the price range over a set number of periods.
Let me make that concrete.
Say you’re looking at a 14-period stochastic on a daily chart. The indicator looks at the last 14 days of price action. It finds the highest high and the lowest low of that 14-day range. Then it calculates where today’s closing price sits within that range — expressed as a percentage from 0 to 100.
If the price closed at the very top of the 14-day range, the stochastic would be near 100. If it closed at the very bottom, it would be near 0. If it closed exactly in the middle, it would be around 50.
That’s it. That’s the whole calculation.
What this tells you is essentially: momentum. Is the market closing near its recent highs (momentum up, stochastic high) or closing near its recent lows (momentum down, stochastic low)?
When you understand this, the overbought and oversold readings make more intuitive sense. A reading above 80 doesn’t mean “the market is too high and must fall.” It means “the market has been consistently closing near the top of its recent range.” That’s actually a sign of strength, not necessarily an immediate reversal signal.
This is the insight that stopped my losses.
The Two Lines — %K and %D Explained Simply
When you add the stochastic oscillator to any chart — TradingView, MetaTrader 4, Thinkorswim, any platform — you’ll see two lines. They’re usually different colors. One moves faster, one moves slower.
The faster line is called %K.
This is the raw stochastic calculation — where the close is relative to the recent range. It moves quickly and can be choppy.
The slower line is called %D.
This is simply a moving average of %K — usually a 3-period average. It smooths out the raw %K line, making it easier to read signals without getting whipsawed by every tiny move.
Most traders watch for crossovers between %K and %D as entry signals. When the faster %K line crosses above the slower %D line, it suggests upward momentum is building. When %K crosses below %D, it suggests downward momentum.
But — and this is critical — not all crossovers are equal. A crossover happening inside the oversold zone (below 20) is far more significant than one happening in the middle of the range (around 50). Context matters enormously with this indicator.
The Settings I Actually Use
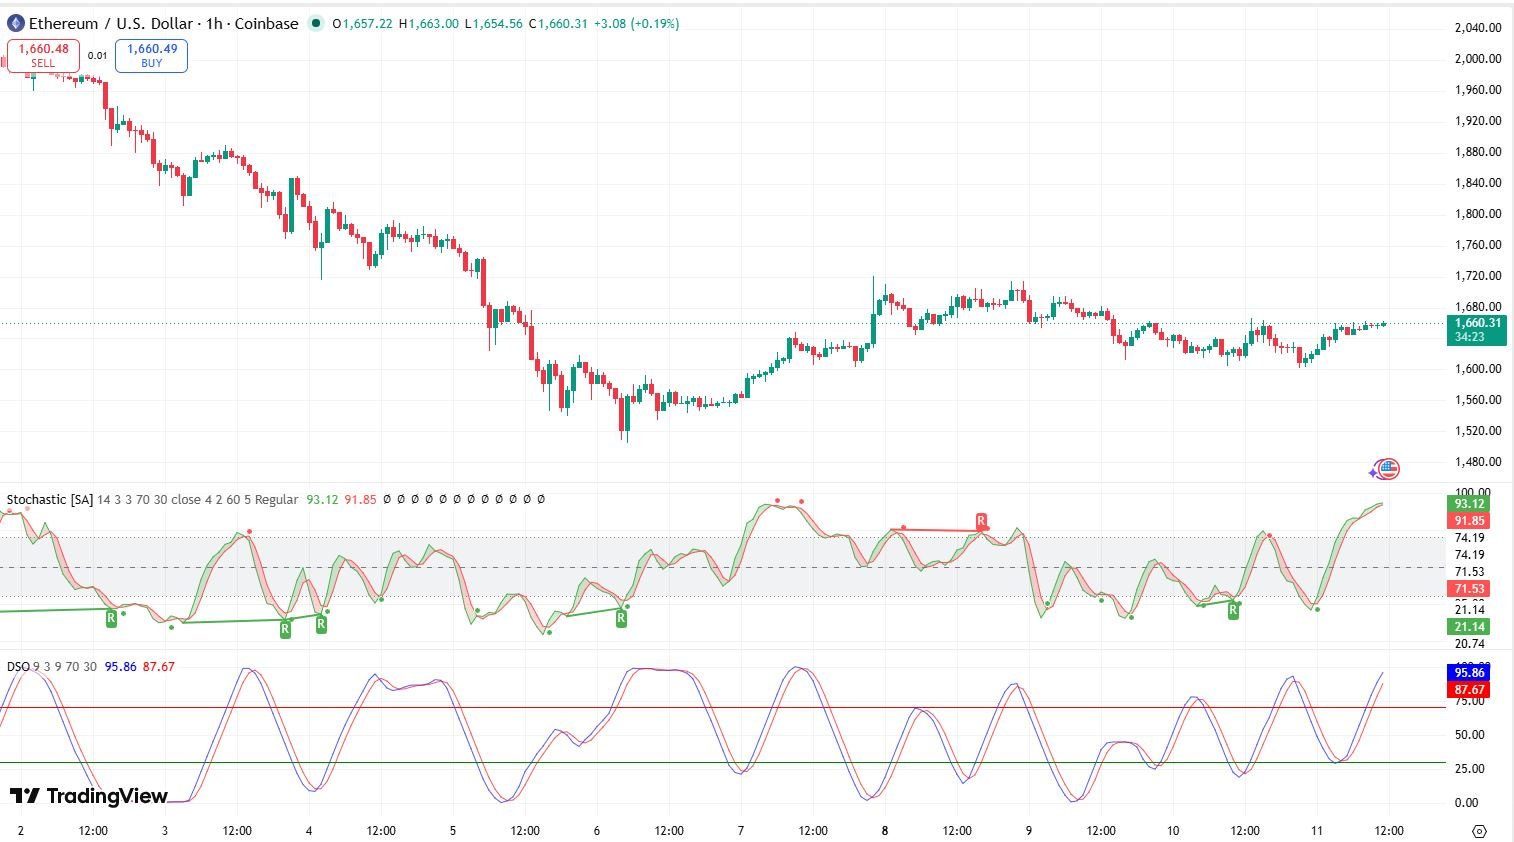
The default stochastic settings on most platforms are 14, 3, 3 — which means a 14-period %K, smoothed by a 3-period moving average for %D, with an additional 3-period smoothing on %K itself.
These are fine for most purposes and are what I used when starting out.
Over time I’ve adjusted depending on what I’m trading:
For swing trading on daily charts: I use 14, 3, 3 — the default. Works well for capturing multi-day momentum shifts.
For day trading on 1-hour charts: I sometimes use 8, 3, 3 — a faster setting that reacts more quickly to intraday momentum changes. More signals, more noise — requires more filtering.
For longer-term position trading on weekly charts: 21, 5, 5 — slower, cleaner signals, fewer false positives.
On TradingView, you change these settings by double-clicking the indicator on your chart. A settings panel opens — you’ll see the three numbers and can adjust them easily.
My honest advice: stick with default 14, 3, 3 until you understand the indicator well. Changing settings before you understand the basics just adds confusion.
Overbought and Oversold — The Most Misunderstood Concept
Every explanation of the stochastic oscillator mentions overbought (above 80) and oversold (below 20). And almost every beginner misinterprets what these mean.
Overbought does NOT mean “sell immediately.” Oversold does NOT mean “buy immediately.”
Let me show you why with a real scenario.
During a strong uptrend — say EUR/USD is in a sustained bullish move over several weeks — the stochastic can sit in overbought territory (above 80) for days or even weeks at a time. If you sold every time it crossed above 80, you’d be fighting a strong trend with multiple losing trades.
The stochastic being overbought in a strong uptrend just means momentum is strong. That’s a description of what’s happening, not a trade signal on its own.
Where oversold and overbought readings become genuinely useful:
In ranging markets — when price is bouncing between support and resistance with no clear trend, the stochastic swings between oversold and overbought regularly. These readings in a ranging environment are much more reliable as reversal signals.
In combination with trend analysis — in an uptrend, oversold readings on the stochastic are potential buying opportunities (pullback entries). In a downtrend, overbought readings are potential selling opportunities. Trading the stochastic with the trend rather than against it dramatically improves the signals.
When combined with price action — an oversold stochastic reading that coincides with price sitting at a major support level, showing a rejection candle, is a much higher-probability entry than an oversold reading in the middle of nowhere.
The Crossover Signal — How to Actually Use It
The crossover is the most common stochastic signal. %K crossing above %D in the oversold zone. Let me walk through exactly how I use it.
Bullish crossover setup:
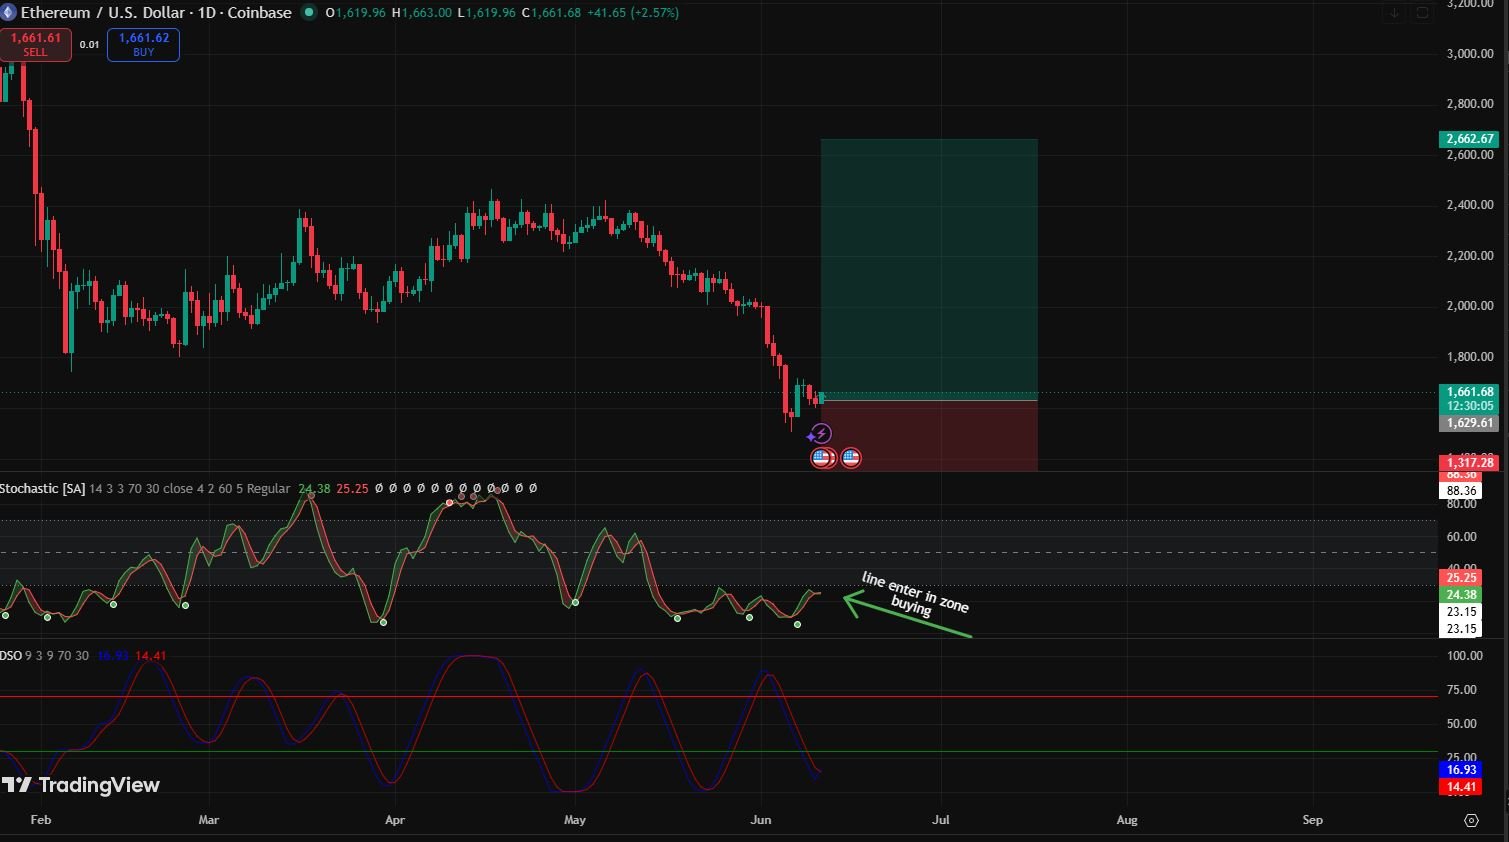
Price has pulled back in an uptrend. The stochastic has dropped into oversold territory — both lines are below 20. Then the faster %K line hooks upward and crosses above the slower %D line. Both lines are still below 20 when the crossover happens.
This is the signal I pay attention to.
I don’t enter immediately on the crossover. I wait for the crossover candle to close. If the candle closes with the crossover confirmed and price is showing some bullish intent (a bullish candle, a rejection of a support level), then I look for an entry.
Bearish crossover setup:
The opposite. Price has rallied in a downtrend. Stochastic is in overbought territory, both lines above 80. The faster %K crosses below the slower %D while both are still above 80.
Wait for candle close. Check price action. If price is showing rejection at a resistance level, consider a short.
The key filter I always apply: is the crossover happening with or against the bigger trend?
On a 4-hour chart showing a clear uptrend, I only take bullish crossover signals in the oversold zone. I ignore bearish crossovers because I’m not interested in counter-trend trades.
Stochastic Divergence — The Signal Most Traders Miss
This is where the stochastic gets genuinely interesting. And this is what I didn’t understand for the first several months of using it.
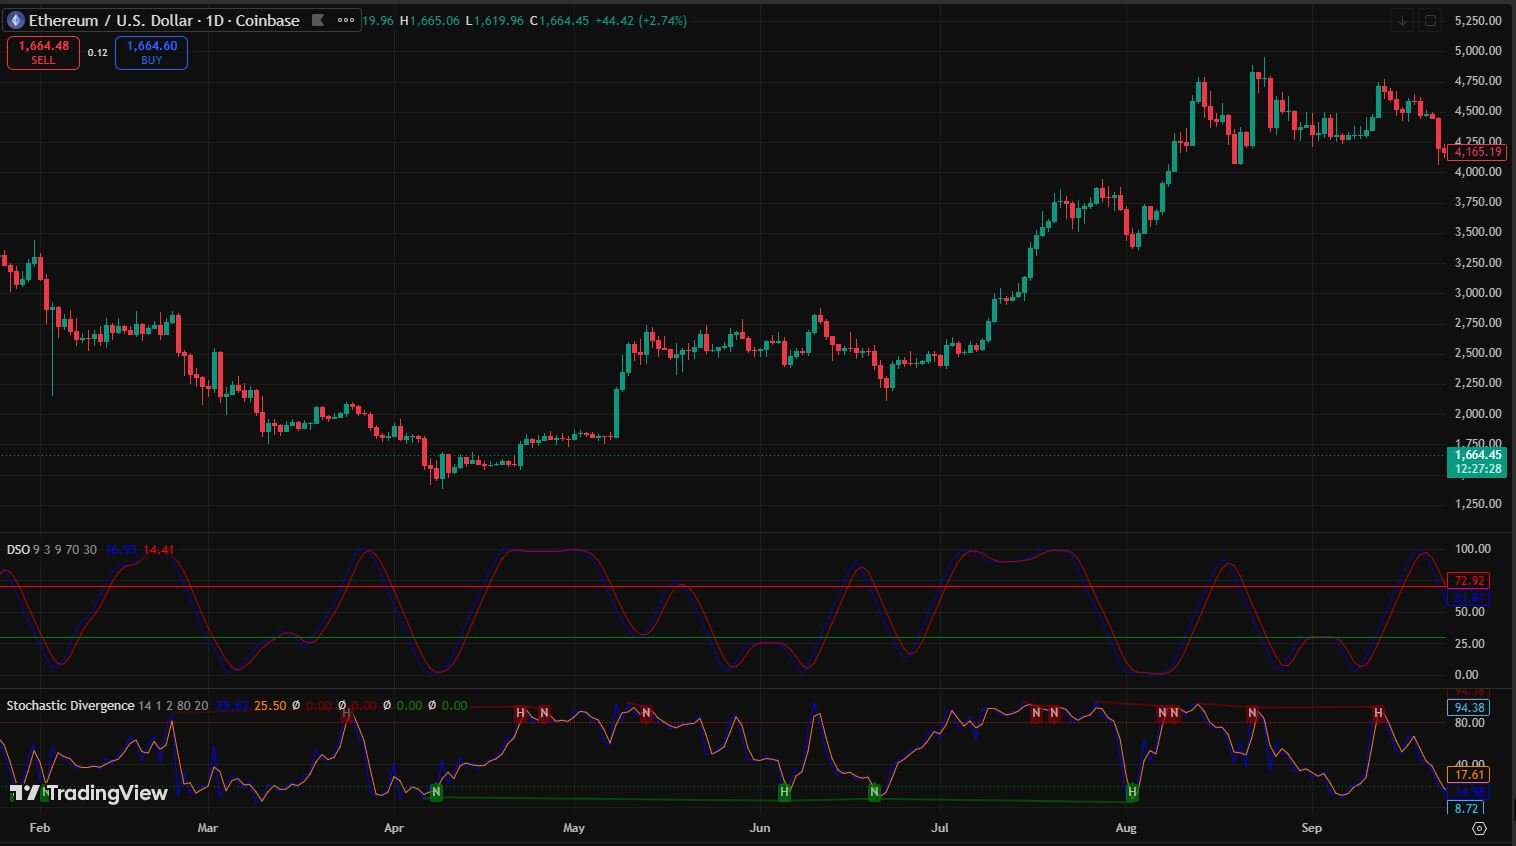
Divergence happens when price and the stochastic indicator are moving in opposite directions.
Bearish divergence: Price makes a higher high, but the stochastic makes a lower high. Price is going up but momentum is weakening. The bulls are losing steam even though price appears to be climbing.
Bullish divergence: Price makes a lower low, but the stochastic makes a higher low. Price is falling but downward momentum is slowing. The sellers are getting tired even though price is still dropping.
Divergence signals are slower to form — they take time to develop across multiple price swings. But when they do form, they’re often more reliable than simple crossover signals because they’re showing you a change in the underlying momentum before price necessarily reflects it.
Let me give you a real example.
I was watching GBP/USD on the daily chart about a year ago. The pair had been in a downtrend. Price made a new lower low at around 1.2150. But the stochastic, instead of also making a new lower low, made a higher low compared to the previous swing.
Classic bullish divergence.
I didn’t enter immediately — divergence tells you momentum is shifting, not that reversal has started. I waited for a stochastic crossover in the oversold zone to confirm. Three days later, the crossover happened. I entered long with a stop below the recent low.
The pair moved 180 pips higher over the next two weeks.
Divergence plus crossover is one of the most reliable combinations the stochastic offers. Learning to spot it takes practice — but it’s worth the effort.
How I Use Stochastic With Other Tools
I never use the stochastic in isolation. By itself, it generates too many false signals. Combined with other tools, it becomes a useful confirmation layer.
Stochastic + Support and Resistance
This is my most common combination. I identify key support levels on the chart using horizontal lines. When price reaches a support level AND the stochastic is in oversold territory showing a crossover, the confluence of both signals significantly increases probability.
Neither signal alone is enough. But both together — price at support with stochastic momentum turning up — is a setup worth taking.
Stochastic + Moving Averages
I use a 50 EMA on the daily chart to identify trend direction. If price is above the 50 EMA, the trend is up — I only take bullish stochastic signals. If price is below the 50 EMA, trend is down — I only take bearish stochastic signals.
This simple filter alone cut my false signals significantly.
Stochastic + Candlestick Patterns
A hammer candle or bullish engulfing at a support level with an oversold stochastic is a very compelling setup. The candlestick pattern shows what price is doing. The stochastic shows that momentum is shifting. Together they tell a consistent story.
Stochastic + RSI
Some traders use both momentum oscillators simultaneously. If both RSI and stochastic are showing oversold readings at the same level, the signal is stronger than if only one is showing it. I occasionally use this combination but find it adds clutter to my charts — something to experiment with.
A Real Trade Walkthrough — Step by Step
Let me walk through an actual trade I took using the stochastic, showing every decision along the way.
The Setup: AUD/USD Daily Chart
The pair had been in a clear uptrend for about six weeks. Because of that, I was specifically looking for a pullback entry — not a reversal, just a chance to join the trend at a better price.
1: Confirmed the Trend
First thing I did was check the bigger picture. Price was sitting above the 50 EMA on the daily chart, which confirmed the uptrend was still intact. Since the trend was clearly bullish, I decided I would only consider long signals — no counter-trend trades.
2: Waited for a Pullback
After confirming the trend, I waited patiently. Price eventually pulled back from a recent high of 0.6820 down to around 0.6680 — roughly 140 pips of retracement. More importantly, this area was also approaching a previous resistance level sitting at 0.6670, which had now flipped to support. So price was pulling back into a meaningful zone, not just random air.
3: Checked the Stochastic
Once price reached that support zone, I looked at the stochastic. Both %K and %D had dropped below 20 — firmly in oversold territory. At this point, three things were lining up together: the trend was up, price had pulled back to a key support level, and the stochastic was showing oversold momentum. Everything was aligning in the same direction.
4: Waited for the Crossover
However, I still didn’t enter. Just because the stochastic was oversold didn’t mean it was time to buy — oversold can stay oversold. So instead, I waited specifically for %K to cross above %D while both lines were still below 20. Two days later, that crossover finally happened. Even better, the crossover candle itself was a bullish candle, meaning price was already starting to show upward intent on its own.
5: Checked for Anything That Could Invalidate the Setup
Before entering, I quickly ran through a few final checks. I opened Forex Factory and confirmed there was no high-impact news scheduled in the next 24 hours for AUD or USD. I also checked broader market sentiment — it wasn’t strongly risk-off, which could have pressured AUD regardless of the technical setup. Everything still looked clean, so the setup remained valid.
6: Entered With Defined Risk
With all checks done, I entered long at 0.6688. My stop went below the support level and recent swing low at 0.6645 — giving me 43 pips of defined risk. My target was the previous high at 0.6820, approximately 132 pips away. That gave me a risk-reward ratio of roughly 1:3, which was well within my acceptable range.
7: Managed the Trade
As price moved in my favor, I managed the position in two parts. First, I took half the position off at 0.6750, locking in some profit. At that point, I also moved my stop on the remaining half to break even, eliminating any further downside risk. The second half eventually reached 0.6810, where I exited completely.
In total, the trade returned approximately 100 pips blended across both exits. Every single decision — from entry to exit — had a clear, logical reason behind it. That’s exactly what a structured trade should look like.
Common Mistakes Traders Make With the Stochastic
Selling every time it hits overbought. In trending markets, overbought can stay overbought for a long time. Fighting a trend with a stochastic signal is a consistent way to lose money.
Taking every crossover regardless of location. Crossovers in the middle of the range (around 40-60) are weak signals. Wait for crossovers in the extreme zones — below 20 or above 80.
Using it on very short timeframes without filtering. On 1-minute or 5-minute charts, the stochastic generates constant signals. Most are noise. If you trade short timeframes, only take stochastic signals that align with the direction shown on a higher timeframe.
Ignoring divergence completely. Most beginner guides focus only on overbought/oversold and crossovers. Divergence is slower to form but often more powerful. Taking time to learn it properly is worth it.
Changing settings constantly. Switching between 5, 14, 21-period settings every few days means you never develop a feel for how the indicator behaves. Pick one setting, use it consistently for at least a few months, and learn its characteristics.
Using it as the only reason to enter. The stochastic is a supporting actor, not the lead. It confirms momentum. It doesn’t replace trend analysis, support/resistance, or risk management. Use it as one piece of the puzzle.
How to Practice Reading the Stochastic
1: Add it to TradingView on a daily chart. Pick any major forex pair — EUR/USD, GBP/USD, USD/JPY. Settings: 14, 3, 3. Overbought level: 80. Oversold level: 20.
2: Scroll back 6 months. Go back in history and just observe. Don’t think about trading yet. Just watch how the stochastic moves in relation to price. Notice when it gives accurate signals and when it fails. Start to see the patterns.
3: Identify the trend first. Add a 50 EMA. For every stochastic signal you see, ask — is this signal going with the trend or against it? Notice how many more of the with-trend signals work compared to counter-trend signals.
4: Look for divergence. Specifically look for moments where price made a new high/low but the stochastic didn’t. Identify how price behaved after those divergence points.
5: Paper trade for one month. Using TradingView’s paper trading feature, take stochastic signals live for a month without real money. Log every trade — setup, entry, stop, target, outcome, what the stochastic was doing. After a month, review the log. The patterns in your results will tell you more than any article can.
6: Move to real money slowly. Start with the smallest position size your broker allows. The psychology of real money changes everything — even if you’ve paper traded successfully. Give yourself time to adapt.
Stochastic on Different Markets
The stochastic works across all liquid markets. I’ve used it on forex, crypto, and indices. The same principles apply.
forex: Works well on major pairs during trending conditions. EUR/USD, GBP/USD, and USD/JPY all show clean stochastic behavior on daily and 4-hour charts.
crypto: Bitcoin and Ethereum show strong stochastic signals on daily charts during trending phases. During sideways crypto markets, the signals are noisier — filter more aggressively.
indices: S&P 500 and other major indices show reliable stochastic divergence around major turning points. Some of the cleanest stochastic divergence setups I’ve seen have been on index charts.
On MetaTrader 4: The stochastic is built in under Insert → Indicators → Oscillators → Stochastic Oscillator. The settings panel appears automatically.
The Indicator That Finally Made Sense
After those painful three months of misusing it, here’s what I know now that I wish I’d known then:
The stochastic oscillator is a momentum tool, not a magic buy/sell signal generator. It tells you where momentum is in relation to recent price range. When momentum is low (oversold) in a market that’s fundamentally going up, there’s often an opportunity. When momentum is high (overbought) in a market going down, there’s often a selling opportunity.
But it requires context. Trend direction. Support and resistance levels. Patience to wait for the right zone and the right confirmation.
Used properly — with the trend, at significant price levels, with crossover confirmation, watching for divergence — it’s one of the cleaner momentum indicators available. Not because it’s magical, but because what it measures is real: the relationship between where price is closing and where it’s been.
Once you understand what it’s measuring rather than just watching the lines, everything about how to use it becomes clearer.
And the trades you almost gave up on before giving the indicator a fair chance? They start making a lot more sense.
Frequently Asked Questions
What does stochastic 5-3-3 mean?
It means 5-period %K calculation, smoothed by a 3-period moving average for %D, with an additional 3-period smoothing on %K. Faster settings — more signals but more noise — best for short timeframe trading.
What is %K and %D in stochastic?
%K is the fast line — it shows where current price sits within the recent range. %D is simply a 3-period moving average of %K — slower and smoother. Crossovers between them generate buy and sell signals.
What are the best stochastic settings for daily?
Default 14, 3, 3 works best for daily charts — it balances sensitivity and reliability perfectly. Faster settings like 5, 3, 3 create too much noise on daily timeframes and generate too many false signals.
What does stochastic below 20 mean?
It means price has been closing near the bottom of its recent range — showing weak downward momentum. In an uptrend, stochastic below 20 signals a potential pullback entry opportunity, not necessarily a reversal.
Disclaimer:
This article is for educational purposes only and does not constitute financial or investment advice. Trading involves significant risk of loss. Always conduct your own research and consider consulting a qualified financial advisor before making any trading decisions.

Hira Ch is a Forex trader and financial content writer specializing in gold, crypto, and currency markets.Based in Lahore, she breaks down complex trading
concepts into simple, actionable insights at ExpertJourny.