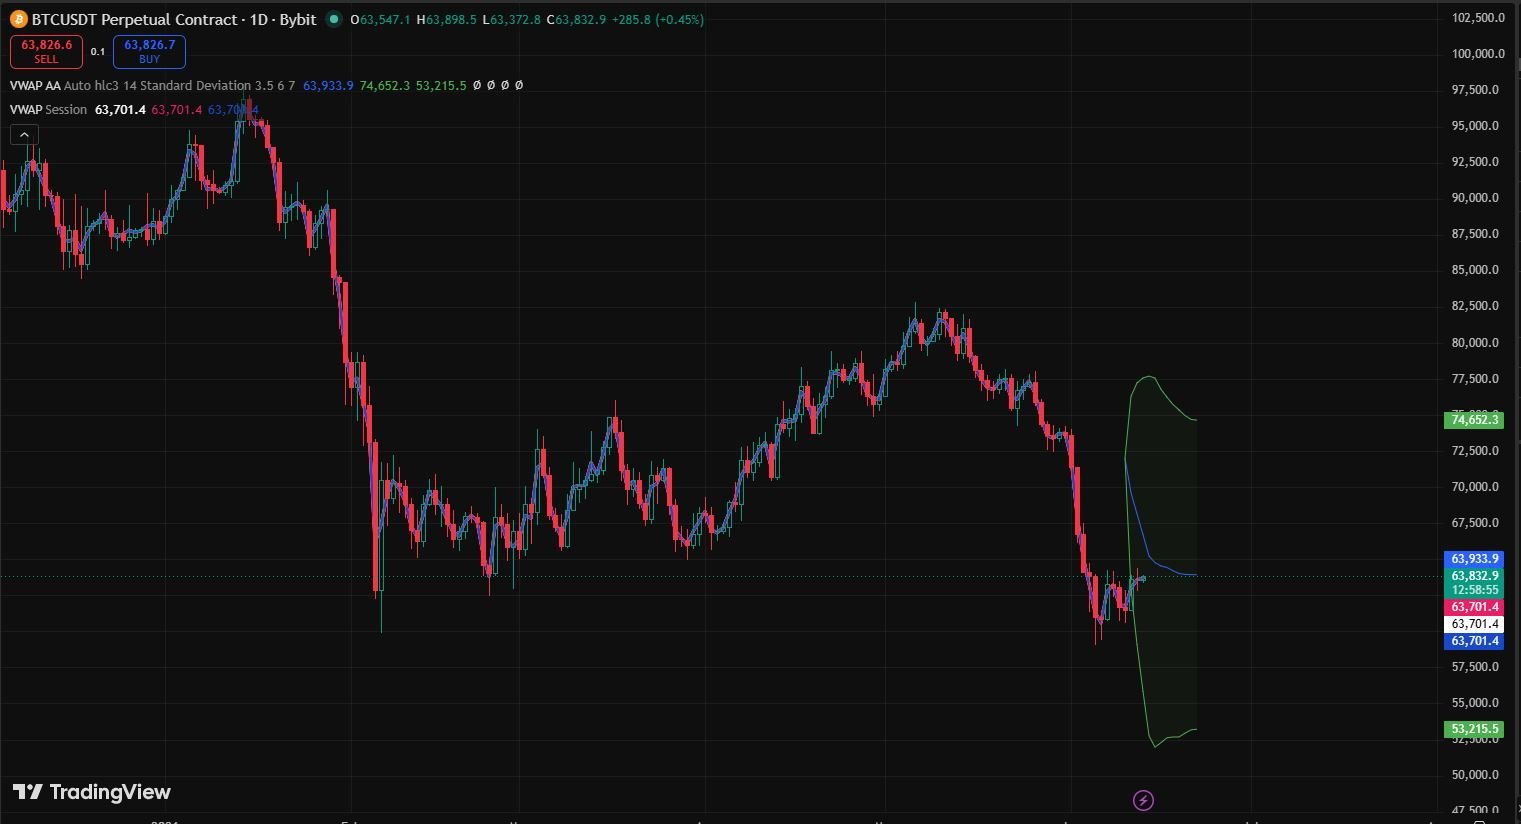
What is Anchored VWAP.I used to think VWAP was just for institutional traders.
That it was one of those indicators that hedge funds and prop desks use — not something a retail trader sitting at home with two monitors and a TradingView free account needed to worry about.
So I ignored it. For almost two years, I traded without it.
Then one afternoon I was watching a live trading session from a trader I respected. He was calling entries in real time on S&P 500 futures. Clean, precise entries. Not based on RSI crossing a line. Not based on a moving average. He kept saying things like “price is rejecting the anchored VWAP from the earnings gap” and “this is the third test of the anchored VWAP from the swing low — watching for a reaction here.”
I had no idea what he was talking about.
I spent that evening going down a rabbit hole on anchored VWAP. By the next morning I had it on every chart I was watching.
Within two weeks I was wondering how I had ever traded without it.
That’s not an exaggeration. Anchored VWAP filled a gap in my analysis that I didn’t even know existed. It explained price reactions that had previously seemed random to me. It gave me levels that were invisible with any other tool.
Let me walk you through everything I’ve learned — not from a textbook, but from two years of actually using it in live markets.
What VWAP Is Before We Get to the Anchored Version
To understand anchored VWAP, you need to understand regular VWAP first — but I’ll keep this brief because regular VWAP has a significant limitation that anchored VWAP was specifically built to solve.
VWAP stands for Volume Weighted Average Price. It calculates the average price an asset has traded at throughout the day, weighted by volume. Higher volume at a certain price means that price has more influence on the average.
Regular VWAP resets every day at market open. It starts fresh on a new candle every session.
This means regular VWAP is useful for intraday trading — seeing where the average price is relative to the current day’s trading. Institutional traders use it to evaluate whether they’re getting a good fill on large orders.
But here’s the limitation: regular VWAP tells you nothing about the average price since a significant event happened. Since an earnings report. Since a major high or low. Since a gap. Since a news catalyst.
Those events are what actually drive price behavior over days and weeks. And regular VWAP, resetting every morning, can’t capture that.
That’s exactly what anchored VWAP solves.
What Anchored VWAP Actually Is
Anchored VWAP is VWAP that you manually attach — anchor — to a specific point in time on the chart.
Instead of resetting every day, it starts calculating from the exact candle you choose. It then tracks the volume weighted average price from that moment forward, continuously, until wherever price is now.
You choose the anchor point. That’s the power and the flexibility of the tool.
You can anchor it to:
- A major swing high or swing low
- An earnings announcement
- A gap up or gap down
- A significant news event
- The start of a new trend
- A breakout point
- Any candle where something meaningful happened in the market
From that anchor point forward, the anchored VWAP shows you where the average participant who bought or sold since that event is currently positioned — profit, loss, or breakeven.
That information is genuinely useful in a way that almost no other indicator provides.
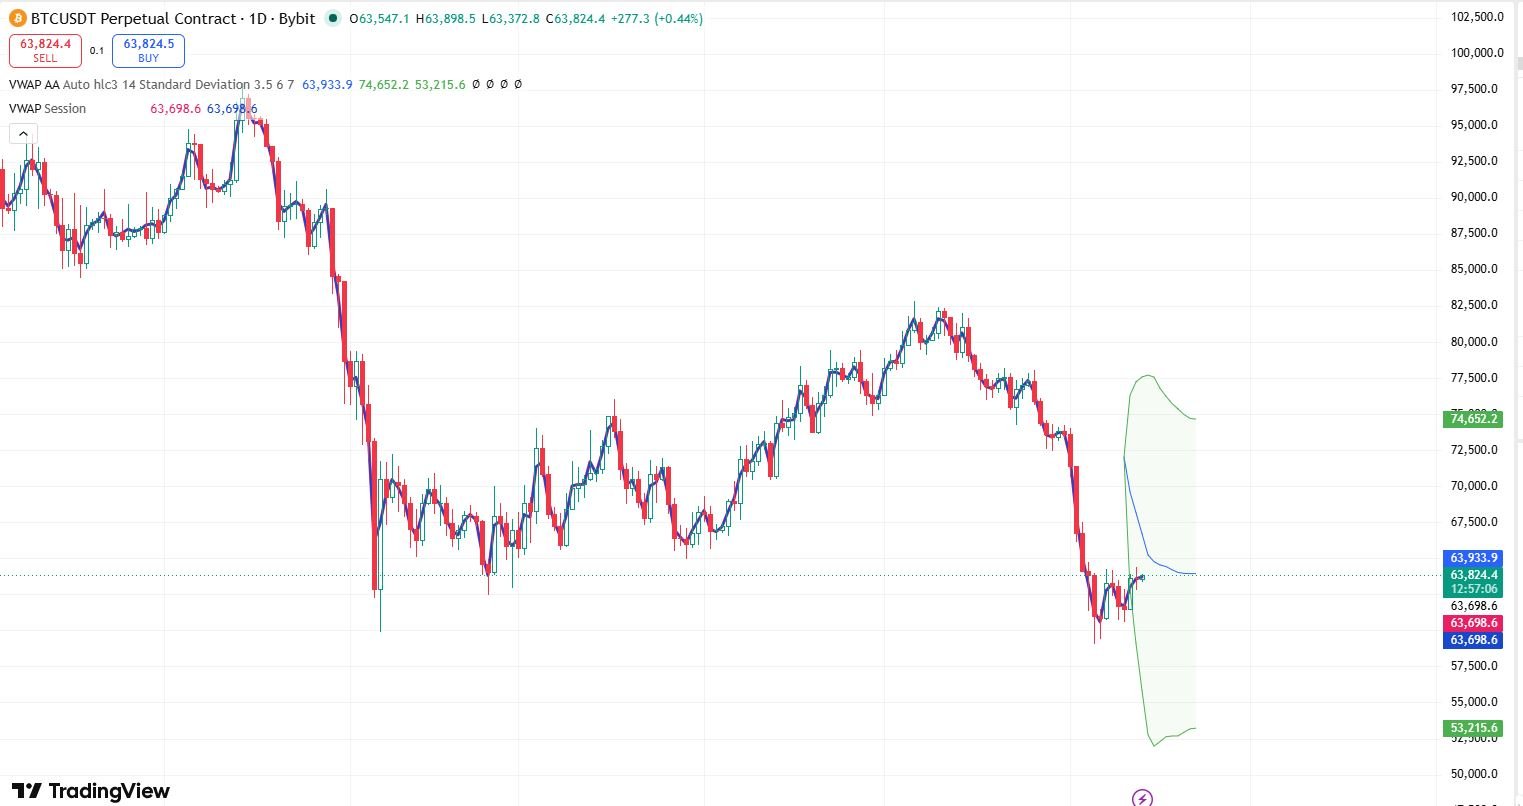
Why Anchored VWAP Works — The Market Logic Behind It
This isn’t just a mathematical curiosity. There’s real market logic behind why anchored VWAP levels matter.
Think about a major earnings release. A company reports strong results and gaps up 8% at the open. Enormous volume trades in the first hour as traders and institutions react to the news. Some buy aggressively. Some sell into the strength.
All those participants who traded in that initial reaction have a cost basis clustered around the VWAP of that move. If you anchor VWAP to the earnings candle, you can see exactly where that average cost basis is.
Now, weeks later, if price pulls back toward that anchored VWAP level — what happens? The participants who bought during the earnings reaction are now roughly at breakeven. Some will add to their positions (average down slightly). Some will hold. The level becomes a natural area of support because it represents a meaningful concentration of participants’ cost basis.
This is why anchored VWAP levels produce real reactions. Not because traders are watching a line on a chart and acting on it — but because the line represents something fundamentally meaningful about where large groups of market participants bought or sold.
Institutions use anchored VWAP too. When a fund bought a large position around an event, they track that anchored VWAP to monitor their average entry. When price returns to that level, they often add. This institutional activity reinforces the level further.
The Four Most Powerful Anchor Points
Not all anchor points are equal. After two years of using this tool across stocks, forex, and crypto, these are the anchor points that produce the most reliable reactions.
Major Swing Highs and Swing Lows
Anchoring to a significant swing high or low is probably the most universally applicable use of anchored VWAP.
When price makes a meaningful low and reverses, a lot of volume trades near that low as early buyers come in. Anchor VWAP to that low and you have a level that tracks where those early buyers’ average cost is. If price pulls back to this level on lower volume weeks later, it often finds support because those buyers are defending their positions near breakeven.
I use this across every market I trade — forex, crypto, US stocks. The swing high/low anchor is my default starting point for any new setup I’m analyzing.
Earnings Gaps and Major News Events
For stocks specifically, earnings are the most powerful anchor points. A gap up on earnings brings enormous volume at a specific price level. Anchor VWAP to the first candle of that gap and you have an institutional reference point that can hold significance for months.
I’ve seen stocks return to an earnings anchored VWAP six weeks after the announcement and find precise support to the dollar. Not because someone predicted it — because that’s where the average cost basis of all the earnings-day buyers sits.
Gap Openings
When a market gaps — opens significantly higher or lower than the previous close — the anchored VWAP from the gap candle becomes a critical level.
Price often returns to “fill” gaps. When it approaches the gap’s anchored VWAP, you frequently see a significant reaction. Either the gap fill holds and price reverses, or the level breaks and the move continues. Either way, it’s a level worth watching.
Market Session Opens
Anchoring to the opening candle of a weekly or monthly session gives you a VWAP that shows where the average participant for that entire period is positioned. This is particularly useful for crypto markets which trade 24/7 — anchoring to the weekly open on Sunday gives you a meaningful reference for the entire week’s trading.
How to Add Anchored VWAP on TradingView — Step by Step
TradingView is where I do all my charting, and it has the best implementation of anchored VWAP I’ve found for retail traders. Here’s exactly how to add it.
1: Open any chart on TradingView — any timeframe, any asset.
2: Click the Indicators button at the top of the chart (or press the “/” key as a shortcut).
3: In the search box, type “Anchored VWAP”. You’ll see it in the results — it’s a built-in TradingView indicator, no download needed.
4: Click on it to add it to your chart. A small crosshair will appear.
5: Navigate to the candle you want to anchor to — the swing low, the earnings candle, the gap open, wherever you’ve decided is the meaningful starting point.
6: Click on that candle. The anchored VWAP will now draw from that point forward, showing the volume weighted average price from your chosen anchor to the current candle.
7: You can add multiple anchored VWAPs simultaneously. I typically have 2-3 on a chart at once — one from the most recent significant low, one from a major prior swing point, and sometimes one from a key news event if relevant.
Customization: Right-click the anchored VWAP line → Format → you can change the color and line thickness. I use different colors for different anchor types — blue for swing lows, orange for swing highs, green for earnings/news anchors.
On the free TradingView plan, you can add anchored VWAP indicators. The Pro plan allows more simultaneously, but free is enough to start.
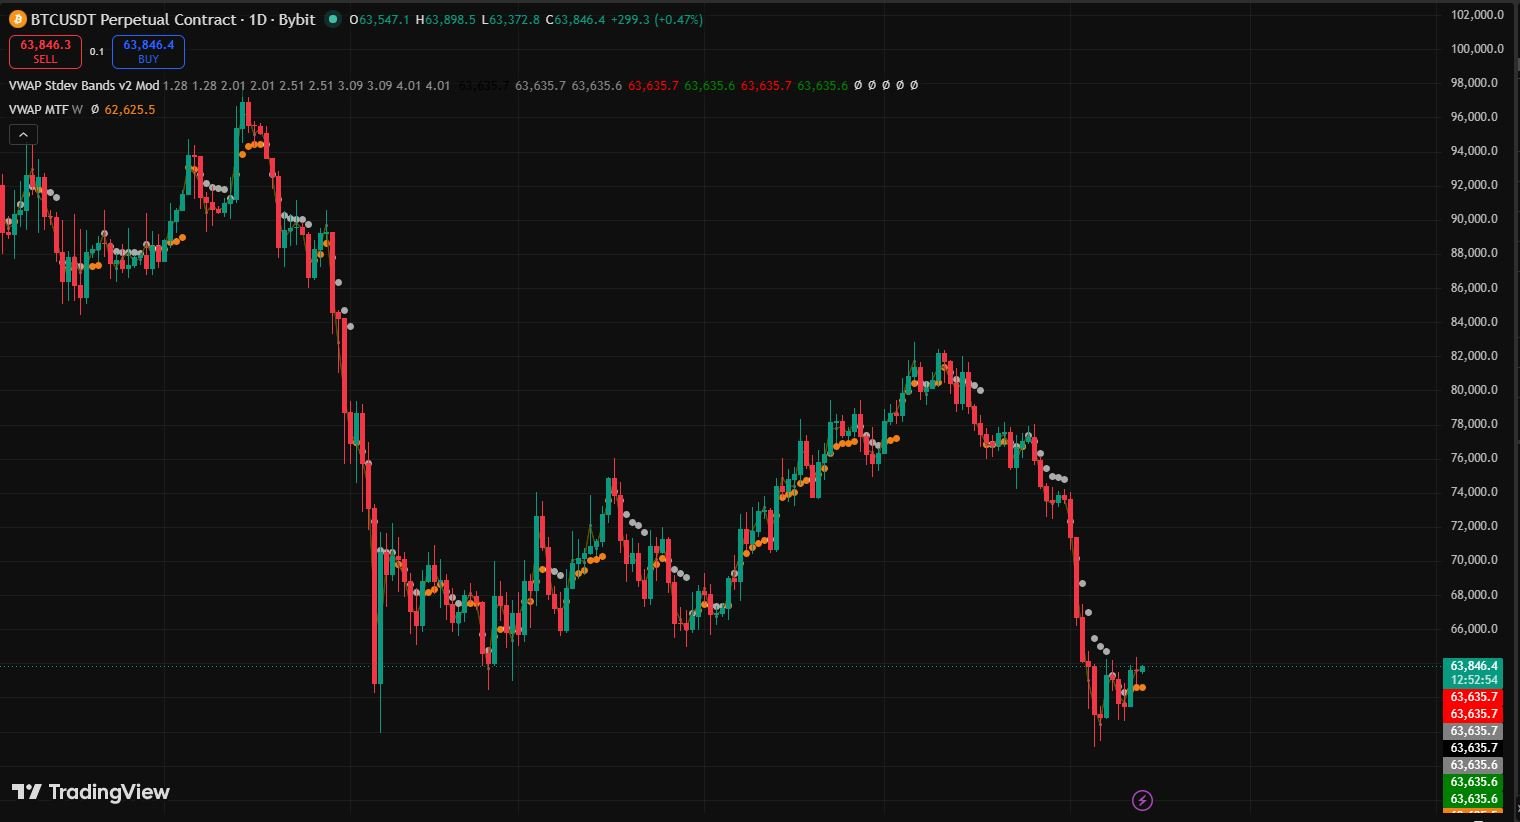
A Real Trade Using Anchored VWAP
Let me walk you through a trade on Gold (XAU/USD) from about four months ago that demonstrates exactly how this works in practice.
Gold had been in an uptrend and made a significant swing low at around $2,285. Strong buying came in at that level — high volume, sharp reversal candle. I anchored VWAP to that swing low candle on the daily chart.
As Gold continued higher over the following weeks, the anchored VWAP from that low tracked the average price of all the buyers who came in at and since that reversal. The anchored VWAP was sitting around $2,340 when price pulled back.
Price retraced down from a local high around $2,385. As it approached the anchored VWAP at $2,340, I started watching the 4-hour chart closely.
Price touched $2,338 — right at the anchored VWAP level — and showed a clear rejection. A 4-hour candle with a long lower wick. Volume on the rejection candle was higher than the preceding bearish candles, showing buying pressure returning.
I entered long at $2,342. Stop below the anchored VWAP at $2,318 — if price closed below the anchored VWAP, the buyers who drove the trend up from the swing low were underwater and the trade thesis was wrong.
Target: the previous high at $2,385.
Price moved to $2,389 over the following four days. I exited at $2,381.
39 dollar move on Gold. Clean entry, clearly defined stop, logical target.
What made it work: the anchored VWAP from the swing low identified exactly where the average buyer from the trend’s origin was positioned. When price returned to that level, those buyers defended it. I simply identified the level in advance and waited for the reaction.
Anchored VWAP in Crypto — Bitcoin Example
The tool works exceptionally well in crypto, partly because crypto trades 24/7 (no daily reset with regular VWAP makes regular VWAP less useful) and partly because Bitcoin in particular has well-defined event-based price levels.
The halving events are natural anchor points for Bitcoin. Anchoring VWAP to the 2024 halving candle and tracking forward gives you a meaningful reference for where the average participant who bought at or since the halving is positioned.
For shorter-term crypto trading, I anchor to weekly opens and significant swing points on the daily chart. Bitcoin shows very clean reactions to these anchored VWAP levels — cleaner than many traditional markets in my experience.
On Binance’s TradingView integration (built into the Binance trading interface), anchored VWAP is available. Bybit similarly uses TradingView charts where you can add it directly.
For crypto specifically, I always have at least one anchored VWAP from the most recent major low on my Bitcoin and Ethereum daily charts. It gives me a constant reference for where the average trend participant is — which tells me a lot about whether the trend has room to continue or whether it’s getting stretched.
Standard VWAP vs Anchored VWAP — When to Use Which
This is a question I get asked a lot since starting to discuss this tool, so let me answer it directly.
Use standard VWAP when:
- You’re day trading intraday — scalping or taking trades you’ll close before the session ends
- You want to see where the average price for the current day’s session is
- You’re trading stocks and want an institutional reference for intraday order execution quality
By Using anchored VWAP when:
- You’re swing trading — holding positions for days or weeks
- You want to understand price behavior relative to a specific event or turning point
- You’re trading crypto (24/7 market — daily resets make standard VWAP less meaningful)
- You want to identify levels that institutional traders are likely watching
- You’re analyzing any situation where a specific historical event is relevant to current price action
For most retail swing traders, anchored VWAP is more useful than standard VWAP in the majority of situations. Standard VWAP is a day trader’s tool. Anchored VWAP works across all timeframes.
Mistakes I Made Learning Anchored VWAP
Anchoring to random candles.
Early on, excited about the tool, I was putting anchored VWAPs everywhere. Every little swing, every minor high and low. The chart became a mess of lines and I lost the signal in the noise.
Lesson: anchor only to significant, obvious turning points. If you have to zoom in three times to find the swing, it’s not significant enough to anchor to.
Treating anchored VWAP as a magic support/resistance level.
Anchored VWAP is not guaranteed support or resistance. Price can and does slice through it when the trend is strong. The tool is most useful when price approaches it from above or below with slowing momentum — not as an automatic buy or sell trigger.
Ignoring volume on the anchor candle.
The power of anchored VWAP depends partly on how much volume traded at and around the anchor point. A swing low with massive volume is a much more powerful anchor than a swing low with below-average volume. I now check volume on any candle I’m considering as an anchor point.
Not combining with other tools.
Anchored VWAP alone is useful. Anchored VWAP plus a bullish order block plus a Fibonacci level in the same zone — that’s a high-conviction trade. I never take entries based on anchored VWAP alone anymore. It’s one piece of a multi-confluence analysis.
Using it on timeframes that are too low.
On 1-minute or 5-minute charts, anchored VWAP becomes noisy. Price crosses back and forth through it constantly and the signal deteriorates. I use anchored VWAP primarily on 4-hour and daily charts for swing trade setups, and only drop to 1-hour for entry timing after the higher timeframe confirms the level.
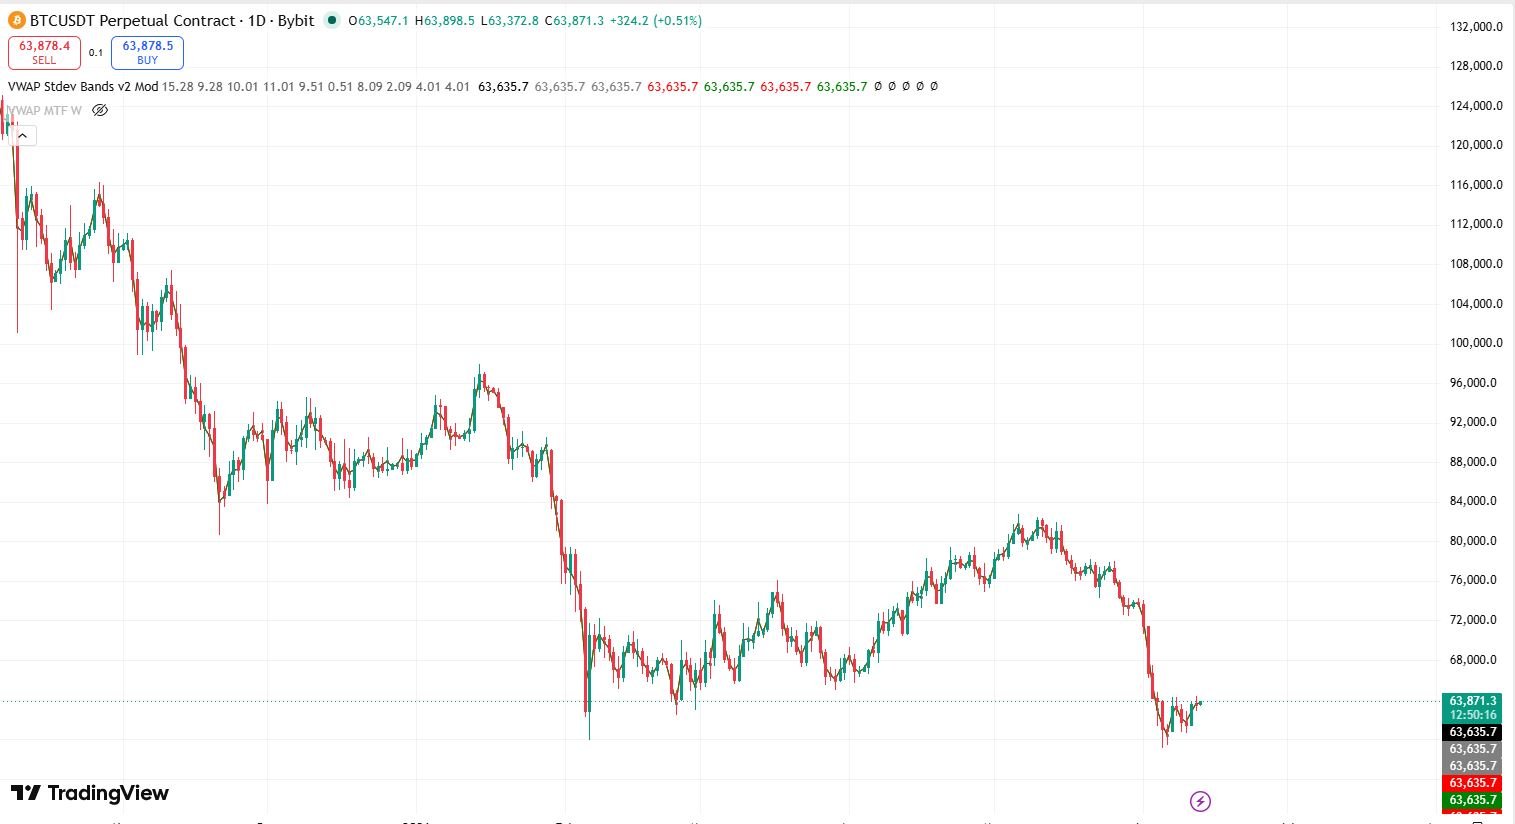
How to Combine Anchored VWAP With Other Tools
This is where the real edge comes from. Anchored VWAP in combination with other analysis is significantly more powerful than any single tool alone.
The Anchored VWAP + Order Blocks (SMC)
When an anchored VWAP level coincides with a bullish order block, the confluence is strong. The order block represents where institutions placed large orders. The anchored VWAP represents the average cost basis of participants since a key event. Both pointing to the same price zone means multiple layers of logic support that level.
The Anchored VWAP + Fibonacci Retracement
Anchoring VWAP to a swing low and then drawing Fibonacci levels from the same swing — if the 61.8% Fibonacci and the anchored VWAP are near the same price, that’s a high-probability support zone. Two completely different calculation methods pointing to the same level is meaningful confluence.
Anchored VWAP + Volume Profile
Volume Profile shows where the most volume has traded across a price range. High Volume Nodes (HVNs) often align with anchored VWAP levels, confirming the significance of that price zone. This combination is particularly powerful for identifying strong support and resistance.
Anchored VWAP + RSI Divergence
If price approaches an anchored VWAP level while RSI shows bullish divergence on the 4-hour chart — lower price, higher RSI — that combination has historically been a strong entry signal in my trading.
Step-by-Step: My Anchored VWAP Process for a New Setup
Before entering any swing trade, this is my process:
1: Identify the most recent significant swing low (for longs) or swing high (for shorts) on the daily chart.
Step 2: Anchor VWAP to that candle on TradingView.
Step 3: Note where the anchored VWAP currently sits and how price is positioned relative to it. Is price above it (bullish context) or below it (bearish context)?
Step 4: If price is pulling back toward the anchored VWAP, switch to 4-hour chart and watch for reaction candles as price approaches the level.
Step 5: Look for confluence — is there an order block, Fibonacci level, or previous support in the same zone?
Step 6: Wait for a rejection candle — preferably a 4-hour or daily candle that tests the level and shows clear buying or selling pressure rejection.
Step 7: Calculate entry, stop (below the anchored VWAP by a small buffer), and target (previous high or logical resistance level).
Step 8: Check funding rates if crypto, check Forex Factory if forex. No entering around high-impact news.
Step 9: Enter with a limit order at the anchored VWAP level or just above it (for longs).
Step 10: Set stop and target immediately. Walk away.
The Tool That Changed My Charts
I said at the start that I spent two years ignoring anchored VWAP. When I finally started using it, I understood why the traders I admired kept referring to levels that seemed invisible on my charts.
Those levels weren’t invisible. I just didn’t have the tool to see them.
Anchored VWAP isn’t complex. The math behind it is straightforward. The logic is intuitive once you understand what it represents — the average cost basis of participants since a meaningful event.
What makes it powerful isn’t the calculation. It’s that it quantifies something that actually matters in markets: where are the participants positioned, and at what price are they underwater or in profit?
That question — where is everyone positioned relative to a key event — is one of the most useful questions you can ask while looking at a chart. Anchored VWAP gives you a clean, visual answer.
Add it to your charts. Spend a few weeks just observing how price reacts when it approaches anchored VWAP levels from significant swing points. Don’t trade it yet — just watch.
You’ll start seeing things you never noticed before.
That’s the moment you’ll understand why traders who use this tool can’t imagine going back to charts without it.
Frequently Asked Questions
What is the difference between VWAP and anchored VWAP?
Regular VWAP resets every day at market open — anchored VWAP starts from any point you choose like a swing low or news event and tracks forward continuously without resetting.
Why is anchored VWAP important?
It shows exactly where the average participant has been buying or selling since a key market event — giving you institutional-level price levels that no other indicator can reveal.
How to draw anchored VWAP?
On TradingView click Indicators, search “Anchored VWAP”, add it, then simply click on the specific candle — swing low, earnings gap, or major event — where you want it to start calculating from.
What are the 3 bands of VWAP?
The 3 bands are standard deviation levels above and below VWAP — Band 1 is closest showing normal range, Band 2 shows extended moves, Band 3 shows extreme overbought or oversold conditions rarely reached.
Disclaimer:
This article is for educational purposes only and does not constitute financial or investment advice. Trading involves significant risk of loss. Always conduct your own research and consider consulting a qualified financial advisor before making any trading decisions.

Hira Ch is a Forex trader and financial content writer specializing in gold, crypto, and currency markets.Based in Lahore, she breaks down complex trading
concepts into simple, actionable insights at ExpertJourny.



One Comment