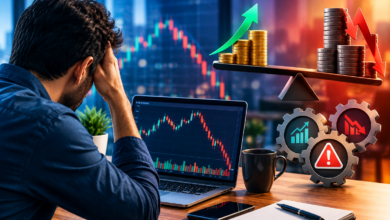
Big Loss in Trading How to Solve Them.The number was sitting there on my screen like it was waiting for me to look at it.
Minus $3,400.
In one week.
I remember the exact feeling. It wasn’t panic — panic would have been easier to deal with. It was something quieter and more unsettling. A kind of hollowness. Like the floor had dropped slightly and I wasn’t sure how far it would keep going.
That money had taken four months to build. I’d been careful, methodical, patient. Then one week of bad decisions — most of them made while trying to recover from the first bad decision — and it was gone.
I didn’t tell anyone for almost two weeks. Not my wife. Not the trader friends I’d made online. I just sat with it, kept looking at the account balance, and tried to figure out how someone who had been doing reasonably well could unravel that completely, that fast.
What I eventually figured out changed how I approach losses permanently. Not just the big ones — all of them.
Because here’s the thing nobody tells you clearly enough: a big loss in trading is rarely one mistake. It’s a sequence. It’s the first mistake, followed by the emotional response to that mistake, followed by the decisions made from that emotional state. The loss compounds not just financially but psychologically.
Understanding that sequence — and knowing how to interrupt it — is the difference between a bad week and a career-ending spiral.
How Big Losses Actually Happen
Let me be specific about my $3,400 week because the pattern is almost universal.
It started with one trade. EUR/USD, 4-hour chart, setup I’d traded successfully before. I entered. It went against me immediately — not gradually, just straight through my intended stop area.
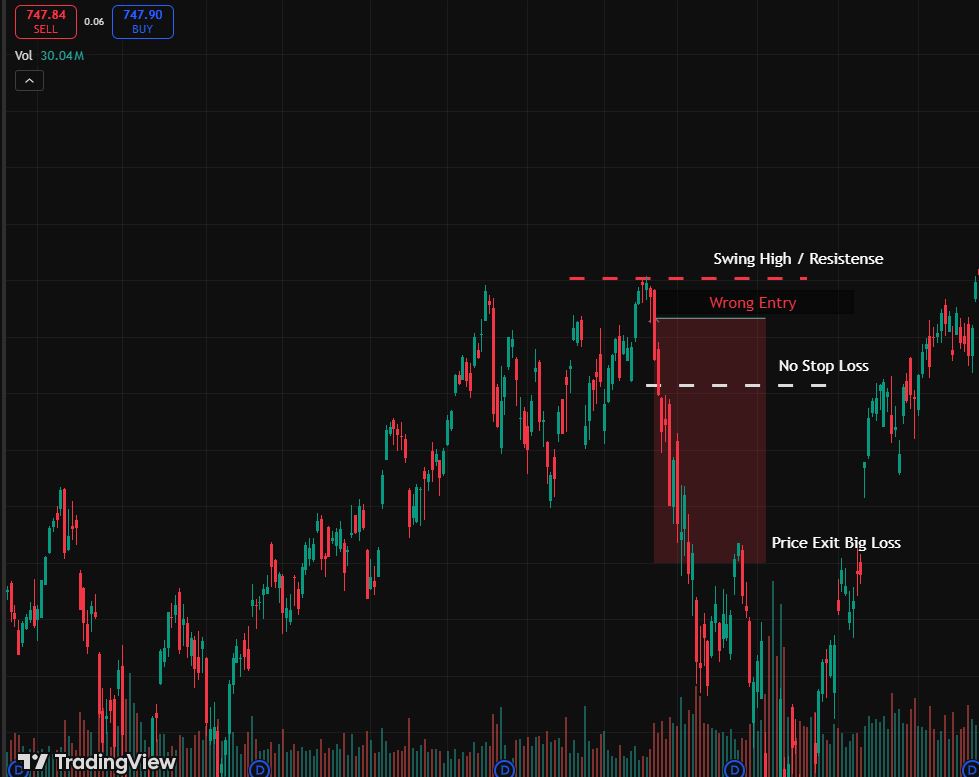
I hadn’t set an actual stop loss on the platform. I was “watching it.”
By the time I manually closed, I was down $680. Painful but manageable.
Here’s where the real problem started.
Instead of stepping back, reviewing what happened, and waiting for the next clean setup — I immediately started looking for a trade to make it back. Not because there was a good setup. Because I needed to fix the number on my screen.
The next trade was worse. I sized up — unconsciously, I think, trying to recover faster. Another loss. Now I was down over $1,000 on the day.
At that point, rational thinking had essentially left the building. Every trade that followed was driven by one thing: get back to even. Not “find a good setup.” Not “manage risk.” Just: get back to even.
By Friday I had made eleven trades in five days. My normal week is maybe four or five. Most of those eleven trades had no real basis. I was just moving. Moving felt like doing something. Doing something felt better than sitting with the loss.
It wasn’t.
That’s how big losses happen. Not usually from one catastrophic trade. From the cascade that follows the first manageable loss.
The Psychology Behind Why We Make It Worse
There’s a concept in behavioral finance called loss aversion. The basic idea: the pain of losing $100 feels roughly twice as powerful as the pleasure of gaining $100.
In trading, this creates a specific and predictable problem.
When you’re up, you tend to take profits early — the gain feels good, protect it. When you’re down, you hold on too long or double down — the loss feels unbearable, do something to fix it.
Both behaviors are irrational. Both are completely normal human responses. And both will drain your account if you let them run unchecked.
After a big loss, most traders experience something close to what athletes call “choking” — the conscious mind overrides the instincts and pattern recognition you’ve spent months or years developing. You stop trusting your process. You start forcing trades, changing timeframes, switching strategies mid-week.
I’ve watched traders abandon systems that were working — genuinely working, with documented edge — after one bad week. They couldn’t separate the system’s performance from their emotional state. The system felt broken because they felt broken.
The market doesn’t know you just had a big loss. It doesn’t care. It just keeps doing what it does. The problem is that you’re now approaching it with a completely different psychological state than the one you had when things were going well.
Stop. Completely.
This sounds obvious. It is obvious. It is also the hardest thing to do after a big loss because every instinct you have screams to keep going, to fix it, to act.
After I finally accepted what had happened in that $3,400 week, I made one rule for myself: after any loss that exceeds my daily limit, no more trading that day. After a loss week that exceeds 5% of my account, no trading for two full days minimum.
Not “reduce position size.” Not “trade on demo.” Stop completely.
Why two days and not just one? Because the first day after a big loss, you’re still in the emotional fog of it. You feel okay but you’re not. The second day, things start to clear. By day three you can usually look at charts without seeing them through the lens of what just happened.
This rule has saved me from myself more times than I can count. The market will always be there. The setups will come back. What won’t come back easily is money lost in a revenge-trading spiral.
Do the Autopsy
Once you’ve actually stopped and given yourself some time, go back and look at what happened. Not to punish yourself — to learn.
I open my trade journal — I use a Google Sheet, nothing fancy — and go through every trade from the bad period one by one.
For each trade I ask three questions:
Was the setup valid?
Did this meet my entry criteria before I entered, or did I force it?
Was risk properly managed?
Did I have a stop loss set on the platform? Was my position size calculated correctly?
Why did I actually take this trade?
Was it because the setup was genuinely good, or because I needed to trade?
That third question is the revealing one. “I needed to trade” is not a reason to trade. But in the moment it feels exactly like a reason.
When I did this autopsy after my worst week, I found that seven of my eleven trades that week had no valid setup behind them. Seven. I was essentially just pressing buttons and hoping.
The journal doesn’t lie. Your memory will rationalize — “that trade made sense at the time.” The journal shows you what actually happened before, during, and after. It’s the most honest feedback you’ll ever get about your own trading.
If you’re not keeping a trade journal, start today. Not next week. Today.
Find Where the System Failed (Or Where You Failed the System)
There’s an important distinction here.
Sometimes a big loss happens because your strategy has a genuine flaw — it doesn’t perform well in certain market conditions, or your risk parameters need adjusting. That’s a system problem.
More often, a big loss happens because you stopped following your system. That’s a you problem. And fixing a you problem by changing your system is one of the most common and costly mistakes traders make.
After my bad week, I initially started questioning my entire approach. Maybe the 4-hour chart wasn’t right. Maybe I needed different indicators. Maybe the whole strategy needed rebuilding.
Then I looked at the journal honestly. The strategy hadn’t failed. I had stopped following it after the first loss. The subsequent trades weren’t part of my system at all — they were panic trades dressed up in strategy language.
The system was fine. I needed to fix my discipline, not my strategy.
Ask yourself honestly: were the bad trades the result of following your system in difficult conditions, or the result of abandoning your system under emotional pressure?
The answer determines what you fix.
Come Back Smaller
When you return to trading after a big loss — and you should return, because hiding from the market forever isn’t an option — come back at reduced size.
Not because your strategy is broken. Because your confidence is shaken, and shaken confidence affects execution even when you don’t realize it.
After my $3,400 week, I came back trading at 25% of my normal position size for two full weeks. It felt almost embarrassing. The wins were small. But something important happened: I started making good decisions again. The smaller size removed the emotional charge from each trade. I stopped white-knuckling every candle.
After two weeks of good decision-making at small size, I moved back to 50%. Then, after another two clean weeks, back to full size.
The process took about six weeks total. In those six weeks I recovered roughly $800 — not all of it, but meaningful progress. More importantly, I rebuilt the psychological foundation that the bad week had eroded.
Speed of recovery matters less than quality of recovery. Coming back too fast, too big, looking to “make it all back in one trade” — that’s the path back to another big loss.
Fix the Specific Hole That Let the Water In
Every big loss has a specific technical failure underneath the psychological one. Find it and fix it concretely.
For me it was two things.
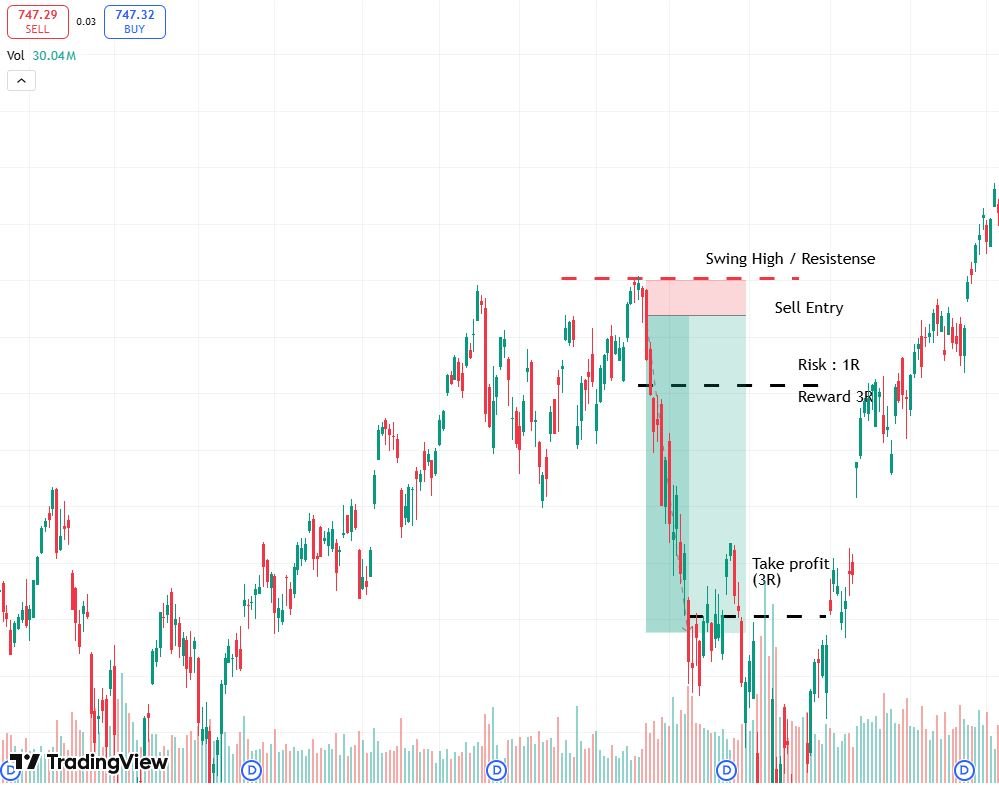
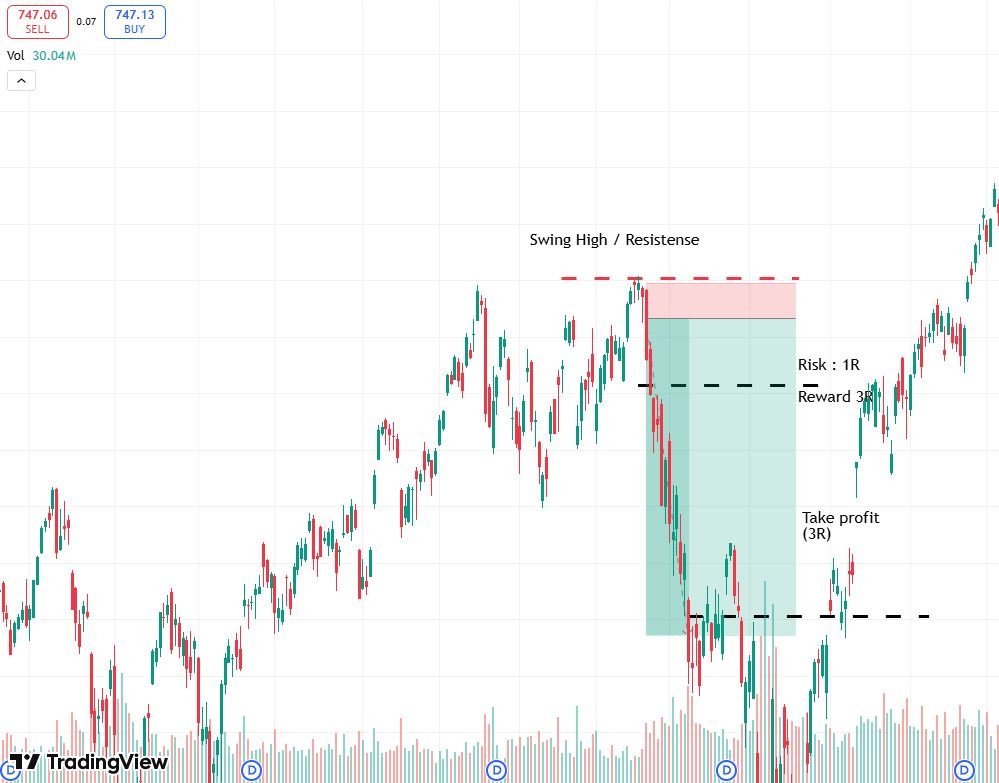
First: I wasn’t setting stop losses on the platform. I was “watching” trades manually. That has to stop permanently. Every trade, stop loss goes in immediately when the order is placed. No exceptions. Not “I’ll set it in a minute.” Not “I’m watching closely.” The stop goes in before anything else.
Second: I had no daily loss limit rule. I didn’t know when to stop. Now I do — 2% of account in a single day, I’m done for that day. No argument, no override.
Both of these are simple mechanical fixes. They don’t require becoming a different person or developing superhuman discipline. They just require setting rules in advance — when emotions are calm — and then following them when emotions are not.
Pre-commitment is the key concept here. You cannot reliably make good decisions when you’re in the middle of a losing streak. So you make the decisions in advance, when you’re thinking clearly, and you commit to following them regardless of how you feel in the moment.
What To Do When The Loss Feels Unrecoverable
Sometimes the number is big enough that the practical recovery path feels impossibly long.
If you’ve lost 30%, 40%, 50% of your account — the math of recovery is genuinely brutal. A 50% loss requires a 100% gain just to get back to even. That can take a long time even when trading well.
Here’s what I’d tell someone in that situation, and what I’ve told myself in smaller versions of it:
The account balance is not the most important thing to recover. The most important thing to recover is your process — your ability to execute good trades consistently and manage risk properly.
If you can do that, the account will follow. Slowly, but it will follow.
Trying to speed up the recovery by taking bigger risks to “catch up faster” is how a 40% loss becomes an 80% loss. The market has no memory of what you used to have. It only knows what’s there now, and what you do with it from here.
Some traders, after a truly catastrophic loss, make the difficult but correct decision to step back from live trading completely for a period. Paper trade. Study. Work on the psychological side. Then come back with a smaller funded account and rebuild properly.
There’s no shame in that. The shame would be in repeating the same pattern with the same emotional responses and expecting different results.
The Tools That Help After a Big Loss
Trade Journal (Google Sheets) — the autopsy tool. Non-negotiable. If you don’t have one, the template is simple: date, pair, direction, entry, stop, target, outcome, notes. Start now.
TradingView — go back and replay the trades. TradingView’s bar replay feature lets you rewind any chart to a specific date and watch price action unfold candle by candle. Use it to review your bad trades without the emotional charge of watching them in real time.
Myfxbook — if you trade forex through MetaTrader, connecting your account to Myfxbook gives you detailed analytics — win rate, average loss, worst drawdown, trading times. Patterns in your losses become visible in the data that you’d never see trade by trade.
A simple daily checklist — before any trading session: have I checked the economic calendar (Forex Factory), do I know my maximum loss for today, is my strategy clear for what constitutes a valid setup. Three questions. Write them down. Answer them before touching the charts.
Talking to another trader — underrated. After my bad week, eventually telling a trading friend what happened was genuinely helpful. Not for advice — just for perspective. Isolation after a big loss feeds the shame spiral. Someone who has been through it themselves can help you see it more clearly.
Mistakes To Avoid After a Big Loss
Immediately looking for one big trade to recover everything. This is how bad weeks become bad months.
Changing your entire strategy because of one bad period. Evaluate whether the system failed or whether you abandoned the system. Usually it’s the second one.
Telling yourself you’ve “learned your lesson” without making concrete mechanical changes. Feeling like you’ve learned something is not the same as changing your behavior. What specific rule are you implementing? What concrete change is being made?
Trading on demo to “rebuild confidence” but then switching back to live before you’re ready. Demo removes the emotional component entirely. If you can’t trade live at very small size, you’re not ready for normal live size. Demo is for learning strategies, not for recovering from psychological damage.
Not giving yourself permission to take a real break. Rest is not weakness. Rest is part of the process. The traders who last years and decades take breaks. They step back when they need to. They return when they’re ready. They don’t grind through psychological damage and wonder why their performance doesn’t recover.
The Thing About Big Losses Nobody Says Out Loud
Every serious trader has one. Usually more than one.
The traders you follow online who seem to never lose — they’ve had their version of this. The ones who are genuinely good have just learned not to let one bad period cascade into something that damages their capital or their psychology permanently.
A big loss is not evidence that you can’t trade. It’s evidence that you’re human, that you have emotional responses to financial pressure, and that your risk management had a gap in it somewhere.
All of those things are fixable.
What separates the traders who come back from the ones who don’t isn’t talent or strategy or even capital. It’s the willingness to look honestly at what happened, make specific changes, and return to the process with patience instead of desperation.
The market doesn’t owe you a recovery. But it will give you opportunities — every single trading day — to make better decisions than you made yesterday.
That’s enough. If you’re honest about what went wrong and disciplined about fixing it, that’s genuinely enough to rebuild from.
Frequently Asked Questions
higest loss in trading how to solve them free?
Stop trading immediately, review every bad trade in a free Google Sheets journal, fix your stop loss rules, and return at reduced size — no paid course needed.
loss in trading how to solve them reddit?
Reddit traders mostly suggest the same things: take a break, do a trade autopsy, reduce position size, and never revenge trade — community experience beats any paid advice.
Biggest loss in trading history?
Nick Leeson lost $1.3 billion trading unauthorized futures contracts and single-handedly bankrupted Barings Bank in 1995 — the most famous trading loss in financial history.
Trading loss screenshot?
A trading loss screenshot shows your closed trade history with negative P&L — useful for journaling, identifying patterns, and honestly reviewing what went wrong.
Disclaimer:
This article is for educational purposes only and does not constitute financial or investment advice. Trading involves significant risk of loss. Always conduct your own research and consider consulting a qualified financial advisor before making any trading decisions.

Hira Ch is a Forex trader and financial content writer specializing in gold, crypto, and currency markets.Based in Lahore, she breaks down complex trading
concepts into simple, actionable insights at ExpertJourny.