Forex Liquidity Explained: Why Some Currency Pairs Move Faster Than Others

Forex Liquidity Explained: Why Some Currency Pairs Move Faster Than Others
The foreign exchange market is one of the world’s largest financial markets, but not every currency pair behaves in the same way. Some pairs can attract significant trading activity and execute orders quickly, while others may experience wider spreads and less consistent price movement.
One important factor behind these differences is forex liquidity.
Understanding liquidity can help traders make better decisions about currency pairs, trading sessions, spreads, and risk management. It can also explain why a currency pair may suddenly move quickly when major economic news is released.
In this guide, we’ll explain forex liquidity in simple terms and explore why some currency pairs tend to move faster than others.
What Is Forex Liquidity?
Forex liquidity refers to how easily a currency can be bought or sold without causing a significant change in its market price.
A highly liquid market generally has:
- A large number of buyers and sellers
- High trading volume
- Many active market participants
- Competitive bid and ask prices
- Faster execution under normal market conditions
When liquidity is lower, there may be fewer participants available at each price level. This can contribute to wider spreads and larger price movements when sizeable orders enter the market.
Why Is Liquidity Important in Forex Trading?
Liquidity affects several parts of the trading experience.
1. Bid-Ask Spreads
The spread is the difference between the price at which a trader can buy and sell a currency pair.
Highly liquid currency pairs often have tighter spreads because many buyers and sellers are competing in the market.
Lower-liquidity pairs can have wider spreads, increasing the cost of entering and exiting positions.
2. Trade Execution
Greater liquidity generally means there are more orders available around the current market price. This can make it easier for traders to enter or exit positions.
However, liquidity does not guarantee a particular execution price. During major announcements or sudden market movements, execution conditions can change rapidly.
3. Price Volatility
Liquidity and volatility are related, but they are not the same thing.
A highly liquid pair can still experience substantial volatility when important economic information changes market expectations.
For example, an unexpected interest-rate decision can cause a heavily traded currency pair to move sharply within a short period.
Which Forex Pairs Are Usually the Most Liquid?
Major currency pairs generally receive substantial trading activity because they involve some of the world’s most widely traded currencies.
Common examples include:
- EUR/USD
- USD/JPY
- GBP/USD
- USD/CHF
- AUD/USD
- USD/CAD
- NZD/USD
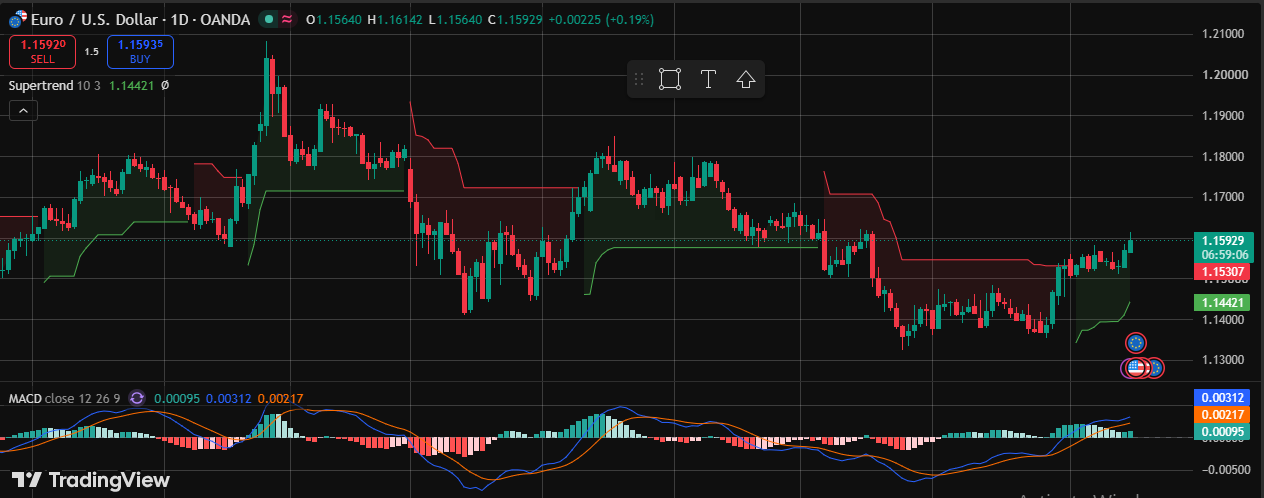
Among these, EUR/USD is particularly well known for its deep market and high trading activity.
The exact level of liquidity can change depending on the time of day, market conditions, economic events, and other factors.
Why Do Some Currency Pairs Move Faster?
A currency pair’s movement is influenced by much more than liquidity.
Several factors can contribute to faster price movement.
Trading Volume
When large numbers of market participants are active, significant amounts of money can enter and leave the market.
High participation can create frequent price changes, especially when traders react to new information.
Economic News
Economic releases can dramatically change expectations about a country’s economy or monetary policy.
Important events may include:
- Central bank interest-rate decisions
- Inflation reports
- Employment data
- GDP figures
- Manufacturing data
- Consumer confidence reports
When the actual result differs significantly from expectations, traders may rapidly adjust their positions.
Interest-Rate Expectations
Interest rates are particularly important in the forex market.
If traders expect a central bank to raise rates, the country’s currency may attract additional demand. Conversely, expectations of lower rates can reduce demand under certain market conditions.
Because expectations can change before an official decision, currency prices may move well before the announcement itself.
Market Session Overlap
Forex operates across major global financial centers.
The London and New York sessions are particularly important because their trading hours overlap for part of the day. During active overlaps, more market participants may be present, potentially increasing trading activity and price movement.
Liquidity and Forex Trading Sessions
Liquidity isn’t constant throughout the day.
The market tends to become more active when major financial centers are open.
Asian Session
The Asian session includes important financial markets such as Tokyo. Some currency pairs involving the Japanese yen and other Asian currencies may receive greater attention during this period.
London Session
London is a major global financial center, making the European session an important period for forex traders.
Trading activity can increase as European markets become active.
New York Session
The New York session is another major period for forex activity, particularly for pairs involving the U.S. dollar.
London-New York Overlap
The overlap between London and New York can attract significant market participation.
This period can provide stronger price movement in some major currency pairs, although traders should remember that higher activity can also mean greater short-term volatility.
Major Pairs vs. Minor and Exotic Pairs
One useful way to understand liquidity is to compare different categories of currency pairs.
Major Currency Pairs
Major pairs usually involve the U.S. dollar and another major global currency.
Examples include EUR/USD and USD/JPY.
They generally have substantial trading activity and are widely followed by traders worldwide.
Minor Currency Pairs
Minor pairs, sometimes called cross pairs, do not include the U.S. dollar.
Examples include:
- EUR/GBP
- EUR/JPY
- GBP/JPY
- AUD/JPY
Their liquidity varies from pair to pair.
Exotic Currency Pairs
Exotic pairs generally combine a major currency with the currency of a smaller or emerging economy.
Examples can include USD/TRY or USD/ZAR.
These pairs may have lower liquidity and wider spreads than many major pairs. They can also experience significant price movements during periods of economic or political uncertainty.
Does Higher Liquidity Mean Lower Risk?
Not necessarily.
This is an important distinction for new traders.
Higher liquidity can contribute to tighter spreads and smoother trading conditions under normal circumstances, but it does not eliminate market risk.
A highly liquid currency pair can still move rapidly because of:
- Unexpected economic data
- Central bank announcements
- Geopolitical developments
- Market sentiment changes
- Large institutional orders
Therefore, liquidity should be considered as one part of risk analysis, not as a guarantee of safer trading.
How Traders Can Use Liquidity Information
Understanding liquidity can help traders plan their strategies more effectively.
Choose Appropriate Currency Pairs
Traders may prefer major currency pairs when they want markets with substantial trading activity and generally competitive spreads.
Consider Trading Hours
Knowing when major forex sessions are active can help traders understand when market participation may increase.
Check Spreads
Before entering a trade, traders should look at the current spread rather than assuming it will always remain constant.
Be Careful Around Major News
Economic announcements can cause sudden changes in liquidity, volatility, and spreads.
Traders should check an economic calendar and understand the potential impact of major events before placing trades.
Manage Position Size
Even a highly liquid currency pair can experience rapid price movements.
Appropriate position sizing and predetermined risk limits can help prevent one unexpected move from causing excessive losses.
What Happens When Forex Liquidity Drops?
When liquidity decreases, market conditions can change.
Traders may encounter:
- Wider spreads
- Faster price jumps
- Greater slippage
- Less predictable short-term movement
Liquidity can decline during certain holidays, outside major trading hours, or around unusual market events.
This is one reason traders should not assume that normal market conditions will continue at all times.
Forex Liquidity vs. Volatility: What’s the Difference?
These terms are often confused.
Liquidity describes how easily assets can be bought or sold with relatively limited price disruption.
Volatility describes how much and how quickly prices change.
A market can have high liquidity and high volatility at the same time.
For example, a major economic announcement can trigger significant movement in EUR/USD while the pair continues to have substantial trading activity.
Understanding the difference between these concepts can help traders interpret market conditions more accurately.
Common Mistakes New Forex Traders Make
Ignoring Spreads
Some beginners focus only on potential profit and overlook trading costs.
Trading During Every Market Condition
Not every market environment is suitable for every strategy.
Confusing Liquidity With Safety
A liquid market can still produce large losses when risk is poorly managed.
Ignoring Economic Events
Major announcements can create unexpected price movements.
Using Excessive Leverage
Leverage can increase both potential gains and potential losses. Traders should understand the risks before using it.
Final Thoughts
Forex liquidity is an important concept for anyone learning currency trading. It helps explain why some currency pairs generally offer tighter spreads and more active markets, while others can experience wider spreads and sharper price changes.
However, liquidity should never be considered in isolation.
Trading volume, market sessions, economic news, interest-rate expectations, volatility, spreads, and risk management can all influence how a currency pair behaves.
By understanding these factors, traders can make more informed decisions about which markets to watch and when to trade them.

Hira Ch is a Forex trader and financial content writer specializing in gold, crypto, and currency markets.Based in Lahore, she breaks down complex trading
concepts into simple, actionable insights at ExpertJourny.


One Comment