
What is a Liquidity Sweep Strategy.I still remember sitting at my desk at 11 PM, staring at a trade that had just stopped me out for the third time in the same week.
Same setup. Same zone. Same result.
My stop loss got hit, price reversed immediately, and went exactly where I had originally predicted. The direction was right. The timing was completely off — and honestly, I had no idea why it kept happening.
My friend Usman, who had been trading a few years longer than me, looked at my chart and said something I didn’t fully understand at the time: “Bhai, they swept your liquidity. You were basically free money for the big players.”
That one sentence sent me down a rabbit hole that completely changed how I read charts. This article is everything I wish someone had explained to me back then — in plain language, no textbook nonsense.
First, What Even IS Liquidity in Forex?
Before we talk about sweeps, you need to understand what liquidity actually means — because most traders think of it as some abstract concept that doesn’t affect them directly.
It does. Constantly.
In the simplest terms: liquidity is where a large number of orders are sitting.
Think about it this way. When price approaches a recent swing high, what do most retail traders do? They place their stop loss just above that level. Every trading course teaches exactly this — “put stops above resistance.”
So now you have hundreds, maybe thousands of traders with their stop loss orders clustered in the same small area. All sitting just above that swing high. Waiting to be triggered.
For a big institution — a bank, a hedge fund, a market maker — that cluster of orders is incredibly useful. They need to fill massive positions. And to fill a massive buy order, they need an equal number of sellers on the other side.
Where are those sellers? Right above that swing high, in the form of all those stop loss orders getting triggered.
That’s liquidity. It’s not some vague concept. It’s actual orders. Real money. And big players know exactly where it lives.
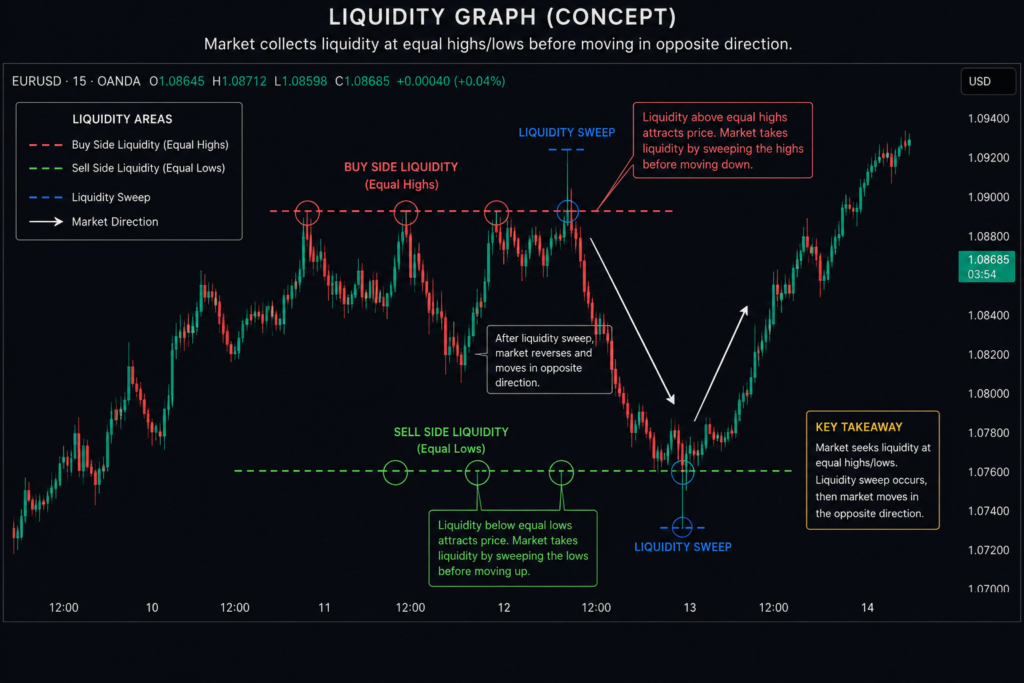
So What Is a Liquidity Sweep?
A liquidity sweep — sometimes called a stop hunt or liquidity grab — is when price deliberately moves into a zone where stops are clustered, triggers those orders, and then immediately reverses.
The entire move exists for one reason: to fill institutional orders.
Here’s what it looks like in practice:
Price approaches a major swing high. Everyone’s watching it. The retail crowd is shorting, stops placed just above. The chart looks perfect for a short entry.
Then, suddenly, price spikes above the high — just slightly. Just enough to trigger all those stops.
Everyone who was short gets kicked out. Their stop losses execute as buy orders.
And who’s on the other side of those buy orders? The institution that was waiting to sell. They just got their entire sell position filled, using your stop loss as the entry fuel.
Then price drops. Hard. Exactly where you originally predicted it would go.
You were right about the direction. But you got stopped out before the move even started.
That’s a liquidity sweep. And it’s not random. It’s not bad luck. It’s the market working exactly the way big players need it to.
The Moment It Finally Clicked For Me
For months, I genuinely believed I was just bad at placing stop losses. So I moved them wider. The sweeps just got bigger. Then I moved them tighter. Got stopped out even faster.
The problem wasn’t my stop placement at all. Rather, the real issue was that I didn’t understand what price was actually doing before a genuine move happened.
The turning point came when I started marking old swing highs and lows on my TradingView charts in a different color — specifically the ones with obvious retail stop clusters sitting above or below them.
Almost immediately, a clear pattern started emerging.
Before a genuine bullish move, price would dip below the most recent swing low first. Just briefly. Just enough. Then it reversed sharply and moved up significantly.
Before a genuine bearish move, price would spike above the most recent swing high. Grab the stops sitting there. Then collapse.
Once I saw it clearly, I couldn’t unsee it. Furthermore, it was happening on every timeframe, across every pair I traded.
How to Spot a Liquidity Sweep on Your Chart
This is the practical part. Here’s exactly what I look for, step by step.
Identify the Obvious Swing Points
On your chart, find the most recent clear swing highs and lows. These are the levels retail traders are actively watching. The more obvious the level, the more liquidity sitting above or below it.
Equal highs are even better. When price creates two or three highs at almost exactly the same level, retail traders treat that as strong resistance. As a result, stops cluster heavily above those levels — which makes them prime sweep targets.
Watch for the Spike Through the Level
When price approaches one of these levels, you’re looking for a candle — usually a wick — that briefly breaks through, then closes back on the other side.
The key word here is “briefly.” A genuine breakout holds above the level. A sweep, however, pokes through and comes straight back.
On a 15-minute or 1-hour chart, this typically looks like a long wick candle that pierces the swing point and then closes back inside the previous range.
Look for Immediate Rejection
After the sweep, price should reject quickly. Not slowly grind back — reject fast. The speed of the reversal matters more than people realize.
If price breaks above a swing high and then spends four or five candles above it before coming back, that’s not a clean sweep. Something else is happening there.
A clean sweep is fast. In, grab the stops, out. In most cases, the whole thing happens within one or two candles.
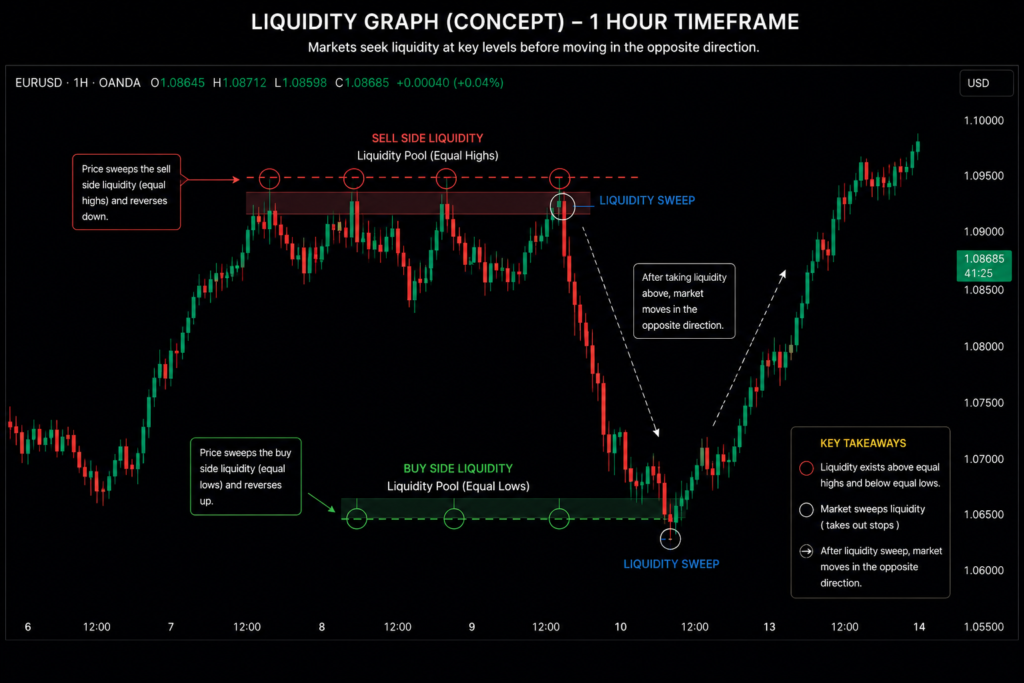
Confirm With Higher Timeframe Context
This step is what separates real setups from noise. A liquidity sweep only matters if it aligns with what the higher timeframe is already doing.
For example, if the daily chart is in a downtrend and you spot a sweep of a swing high on the 1-hour, that’s a high-probability setup. The sweep happened in the direction of the daily bias — everything lines up.
On the other hand, if you’re trying to trade a sweep against the daily trend, you’re fighting the current. It might work occasionally, but your win rate will suffer consistently.
Enter After Confirmation, Not During
I never enter during the sweep itself. Instead, I wait for confirmation that price has actually reversed.
Specifically, I wait for the candle that swept the level to close back below it (for a short setup). Then on the next candle’s open, I enter.
Stop loss goes just above the wick high. Target is the next significant level below.
The Timeframes That Actually Work Best
Over the years, I’ve tested this on everything from the 5-minute chart all the way to the weekly.
Here’s my honest assessment:
4-hour and 1-hour are where the clearest sweeps consistently appear. The setups are more visible, there’s less noise, and the risk-to-reward ratio is manageable for most traders.
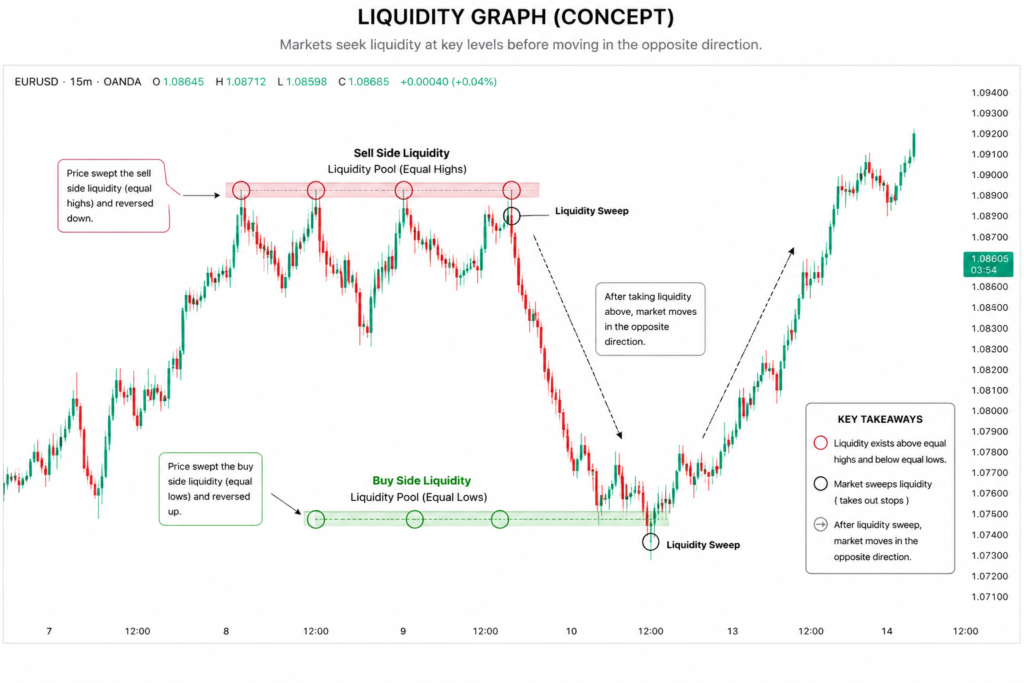
15-minute can work, but you’ll encounter a lot of false signals. The liquidity at this level is less significant — smaller stops, smaller players, less reliable reversals.
Daily timeframe sweeps are the most powerful of all. However, they take longer to play out and require wider stops. If you’re position trading, these are absolutely worth watching.
Personally, I do most of my analysis on the 4-hour, then drop down to the 1-hour to find my actual entry.
TradingView is the platform I use for all of this. The free version is honestly fine for spotting these setups — you don’t need any special indicator. Clean price action and clearly marked levels are all you need. MT4 and MT5 work too, but the charting experience is clunkier. TradingView makes it significantly easier to mark your levels and see sweeps clearly.
Mistakes I Made — So You Don’t Have To
Treating Every Wick as a Sweep
This was my biggest error in the early months. After learning about liquidity sweeps, I started seeing them everywhere. Every candle with a long wick became a “liquidity grab” in my head.
Not every wick is a sweep. A genuine sweep requires specific context: a clear swing point, obvious retail stops clustered there, and a fast rejection.
Random wicks in the middle of a range are simply noise. I wasted dozens of trades chasing fake setups before I finally understood this distinction.
The filter I use now is simple: the swept level needs to be clearly visible on the chart without me having to search for it. If I’m convincing myself that a level is significant, it probably isn’t.
Entering Too Early
The sweep happens. Price spikes above the swing high. My first instinct is to short immediately.
Nine times out of ten, that impatience costs money. Either price hasn’t finished the sweep and pushes higher, or the reversal takes longer than expected and I get shaken out before the real move starts.
Now, I always wait for the candle to fully close below the swept level. Then I enter.
That single discipline change improved my win rate noticeably. Impatience is genuinely expensive in this strategy.
Ignoring the Higher Timeframe
I once had a beautiful 1-hour sweep setup on EURUSD. Textbook execution — swing high, spike above, clean rejection. I shorted it confidently.
Then I realized I’d forgotten to check the daily. The daily was in a strong uptrend approaching a key resistance zone. The “sweep” on my 1-hour was actually just a minor pullback within a much larger move.
I got stopped out. Price eventually came back up and broke through strongly.
The setup itself wasn’t wrong. The context was completely wrong. Always check one or two timeframes above wherever you’re trading.
Expecting It to Work Every Time
Liquidity sweeps are high probability — but they’re not certainties. Some months my win rate on these setups sits around 70%. During rough patches, it can drop closer to 50%.
Any strategy that involves reading institutional behavior carries natural variance. Big players don’t always do the predictable thing. Sometimes what looks like a sweep turns into a genuine breakout.
Risk management matters here just as much as the actual setup. I risk 1% per trade, consistently. That way, even a bad streak doesn’t damage the account beyond recovery.
How I Combine This With Order Blocks
One thing that made the strategy significantly more powerful was combining it with order blocks.
An order block is essentially the last significant bullish or bearish candle before a major price move. Institutions frequently return to these levels to fill additional orders.
Therefore, when a liquidity sweep happens and price reverses back into a strong order block on the same timeframe, that’s genuine confluence. Two separate reasons to take the trade, instead of just one.
It doesn’t happen on every setup. But when it does, those trades tend to be my highest conviction entries.
I learned the order block concept from ICT (Inner Circle Trader) content on YouTube. Like him or not, his concepts around institutional order flow genuinely changed how I understand price movement at a deeper level.
A Real Setup Walkthrough
Let me walk through exactly how I’d think through a live setup.
It’s Monday morning. I open TradingView and pull up GBPUSD on the 4-hour chart.
I notice that over the past week, price created a clear swing high at around 1.2750. It pulled back, built a range, and is now approaching that same high again.
I mark 1.2750 as a key level — obvious to any retail trader watching the chart.
Next, I check the daily. The daily shows that 1.2750 sits right inside a strong historical resistance zone, an area where price has reversed multiple times over recent months. Daily context is clearly bearish above that level.
Back on the 4-hour, price pushes up to 1.2758 — slightly above the swing high. The candle wicks above and then closes back below 1.2750. That’s the sweep. The stops above 1.2750 just got triggered.
I wait for the candle to fully close. Confirmed close below 1.2750.
On the next candle’s open, I short at market. Stop loss goes at 1.2765 — just above the wick high. Target is the next major support level at 1.2680.
Risk: 15 pips. Reward: 70 pips. Risk-to-reward of approximately 1:4.7.
That’s the ideal version of this setup. Not every trade looks this clean, but this is exactly what I’m hunting for.
Is This Strategy Actually For You?
This works well if:
- You already understand basic price action and can read a chart confidently
- You’re patient enough to wait for confirmation instead of anticipating moves
- You trade major pairs like EURUSD, GBPUSD, USDJPY — instruments with high institutional participation
- You’re comfortable occasionally missing a trade because the confirmation never came
This probably isn’t for you if:
- You’re a complete beginner who hasn’t learned support and resistance yet — build that foundation first
- You want a purely mechanical system with exact rules and zero judgment required
- You trade exotic pairs or very low-liquidity instruments where institutional behavior is unpredictable
- You tend to enter early and struggle with waiting for candle closes
The strategy genuinely requires chart reading skill and patience. It’s not a plug-and-play indicator system. If you’re looking for something fully automated, this isn’t it.
Final Thought
Understanding the liquidity sweep concept completely rewired how I see price movement.
Before this, I thought market moves at the micro level were essentially random — unpredictable noise that you could occasionally catch if you got lucky with your timing.
Now I understand that much of what looks like random noise is actually deliberate. Big players need liquidity to operate. They go where the stops are. They use retail traders as the fuel for their own institutional entries.
That’s not a conspiracy. It’s simply how markets with large participants function.
Understanding this won’t make you profitable overnight. I still have losing trades. I still get swept sometimes when I’m not paying attention to context.
But knowing why it happens — and being able to recognize the pattern before it fully completes — has made me more consistent than any indicator I ever tried.
The next time your stop gets hit and then price goes exactly where you predicted, don’t just feel frustrated. Study that candle carefully. That was a liquidity sweep. And now you know exactly what to look for.
Frequently Asked Questions
Liquidity Sweep PDF — what is it?
A liquidity sweep PDF is a downloadable guide explaining how institutions trigger retail stop losses before reversing price. Most traders use it to study smart money and ICT-based concepts.
How to identify a liquidity sweep in trading?
Look for a long wick candle that briefly breaks above a swing high or below a swing low, then immediately closes back inside the range. That fast rejection is the key sign of a liquidity sweep.
What does a liquidity sweep look like on a chart?
On a chart, it looks like a false breakout — price pierces a key swing level with a long wick, then closes sharply back below it. Spike in, reverse out.
What is the difference between a liquidity sweep and a liquidity grab?
Both terms describe the same concept — price hunts stop clusters and reverses. Some traders use “sweep” for higher timeframe moves and “grab” for smaller ones, but in practice they mean the exact same thing.
The content in this article is based on personal trading experience and is provided for educational purposes only. Forex trading involves significant financial risk. Always conduct your own research before making any investment decisions.
Hira Ch is a Forex trader and financial content writer specializing in gold, crypto, and currency markets.Based in Lahore, she breaks down complex trading
concepts into simple, actionable insights at ExpertJourny.