Fibonacci retracement is one of the most popular tools used in technical analysis to understand price movements in the financial markets. Traders use it to identify possible support and resistance zones, find better entry opportunities, and improve overall trading decisions. The concept comes from the Fibonacci sequence, a mathematical pattern that appears in nature and market behavior.
By applying these ratios on a price chart, traders can spot likely price retracement areas where the market may pause, reverse, or continue its trend. In simple terms, Fibonacci retracement helps traders read market structure more clearly and plan trades with stronger logic instead of guessing market direction.
What Is Fibonacci Retracement in Trading
The Fibonacci retracement is a widely used Fibonacci trading tool in technical analysis. Traders apply the Fibonacci retracement indicator to a Fibonacci retracement chart to identify possible support and resistance zones where price may react. These levels are calculated using the Fibonacci sequence, which appears in mathematics, nature, and even financial markets.
When markets move strongly in one direction, they rarely move in a straight line. Instead, the price usually makes a price pullback before continuing its direction. This temporary correction is known as a price retracement. By applying Fibonacci retracement levels, traders attempt to predict where the market may pause or reverse.
Because of its ability to highlight Fibonacci support levels and Fibonacci resistance levels, the Fibonacci retracement indicator explained is considered one of the most practical trading indicators. Traders combine it with chart patterns and other tools to improve their trading strategy confirmation and overall market trend analysis.
Why Fibonacci Retracement Is Important
Many traders rely on Fibonacci retracement because it helps them understand where the market may react during a price retracement. Instead of guessing potential turning points, traders use Fibonacci retracement price levels to find areas where buying or selling pressure may increase.
During a bullish trend, traders often look for a price pullback to a key level before entering a trade. In a bearish trend, the same levels may act as resistance. This method is commonly called Fib pullback trading.
Another reason traders value this method is risk management in trading. When using a trading strategy, traders can define clear entry and exit points, place a stop loss order, and set realistic take profit level targets. This structured approach makes the strategy popular among both beginner and professional traders.
")
History Behind the Fibonacci Sequence
The foundation of Fibonacci retracement comes from the famous Fibonacci sequence. This mathematical pattern has existed for centuries and was later adopted in technical analysis to study financial markets.
The sequence works in a simple way. Each number equals the sum of the two numbers before it. For example: 0, 1, 1, 2, 3, 5, 8, 13, and so on. When traders study these numbers, they discover ratios that form the basis of Fibonacci levels in trading.
These ratios became extremely important in golden ratio trading because they help identify natural patterns in market trends. Over time, traders realized that the same ratios could help predict potential trend reversal or trend continuation areas during trading chart analysis.
Who Discovered Fibonacci Numbers
The Fibonacci sequence became widely known through the work of Leonardo of Pisa, often called Fibonacci. In the 13th century, he introduced this mathematical concept to Europe through his book Liber Abaci. His work helped replace Roman numerals with the modern number system.
Although Fibonacci did not originally invent the sequence, he popularized it. Over time, mathematicians discovered that the sequence connects closely with the golden ratio, which later became important in technical analysis and trading indicators.
Today, Fibonacci’s discovery influences many fields including architecture, biology, and financial markets. In trading, the sequence forms the basis of Fibonacci retracement levels, which traders use to analyze market trends and potential trend reversal areas.
Understanding the Fibonacci Sequence
The Fibonacci sequence is easy to understand once you see the pattern. Each number equals the sum of the two numbers before it. This mathematical structure creates repeating ratios that appear in many natural systems.
Traders discovered that these ratios often appear in financial markets as well. This observation led to the development of the Fibonacci retracement indicator used in trading chart analysis.
Because market trends are influenced by human behavior and psychology, the same mathematical ratios can help identify likely price retracement zones. That is why the Fibonacci sequence in trading became a powerful part of modern technical analysis.
The Golden Ratio Explained in Trading
The golden ratio is one of the most famous numbers derived from the Fibonacci sequence. It equals approximately 0.618 and plays a central role in golden ratio trading.
In trading, this ratio forms the important 61.8 Fibonacci level, which traders often consider the strongest reversal levels. When price reaches this area, markets often show strong reactions.
Because of this behavior, traders closely watch the 61.8 Fibonacci level during market trend analysis. Many strategies rely on this level to determine possible entry points and future profit targets.
")
Key Fibonacci Retracement Levels Every Trader Should Know
The Fibonacci retracement levels are based on ratios from the Fibonacci sequence. Each level represents a potential reaction area where price might pause during a price retracement.
Below is a table showing the most important Fibonacci levels in trading.
| Level | Trading Meaning |
|---|---|
| 23.6 Fibonacci level | Very shallow pullback |
| 38.2 Fibonacci retracement level | Common correction level |
| 50 Fibonacci level | Psychological midpoint |
| 61.8 Fibonacci level | Golden ratio support |
| 78.6 Fibonacci level | Deep retracement zone |
These levels form the backbone of any Fibonacci retracement analysis and help traders locate support and resistance zones during market trends.
Meaning of 23.6% Fibonacci Level
The 23.6 Fibonacci level represents a very shallow price retracement. When price only retraces this small amount, it usually indicates strong momentum in the current bullish trend or bearish trend.
Traders often interpret this level as a sign that the market is extremely strong. In many cases, price barely corrects before continuing its movement.
Because of this, some traders use the 23.6 Fibonacci level to enter aggressive trades during trend continuation setups.
Meaning of 38.2% Fibonacci Level
The 38.2 Fibonacci retracement level is one of the most common levels in Fibonacci retracement pullback trading. It represents a healthy correction during a strong trend.
Many traders see this level as the first strong Fibonacci support levels area during an uptrend. If price reacts positively, traders may enter positions expecting further upward movement.
Similarly, during a downtrend the 38.2 Fibonacci retracement level may act as resistance. This makes it useful for identifying potential Fibonacci retracement entry points and planning Fibonacci retracement stop loss placement.
Meaning of 61.8% Fibonacci Level
The 61.8 Fibonacci level is considered the most powerful level in golden ratio trading. This level comes directly from the golden ratio, which appears repeatedly in the Fibonacci sequence and in natural systems.
When the market reaches this level during a price retracement, traders pay close attention because it often becomes a strong Fibonacci support levels or Fibonacci resistance levels zone. Many Fibonacci retracement trading strategy setups are built around this level.
In many financial markets, including the forex market and stock market, traders use the 61.8 Fibonacci level to identify possible trend reversal signals. It is also commonly used to determine Fibonacci retracement entry points and manage risk management in trading.
")
How to Draw Fibonacci Retracement on a Chart
Learning how to use Fibonacci retracement begins with correctly drawing the indicator on a chart. Most trading platforms such as MetaTrader or TradingView include this trading tool.
The first step is to identify a clear swing high and swing low. In an uptrend, traders draw the Fibonacci retracement from the lowest point to the highest point. In a downtrend, they draw it from the highest point to the lowest point.
Once the tool is applied, the platform automatically displays the Fibonacci retracement price levels. These levels help traders perform accurate market trend analysis and identify potential price pullback zones.
Identifying Swing High and Swing Low Points
Correctly identifying swing high and swing low points is one of the most important steps in Fib analysis. These points represent the major turning points of a trend.
A swing high occurs when the price reaches a peak before falling. A swing low occurs when the price reaches a bottom before rising again. These points create the foundation for accurate trading chart analysis.
If traders choose incorrect swing points, the Fibonacci retracement levels may become inaccurate. That is why experienced traders study chart patterns and market trends carefully before applying the indicator.
Using Fibonacci in an Uptrend Market
During a bullish trend, traders use to find possible buying opportunities. Instead of buying at the top of a move, traders wait for a price pullback toward key Fibonacci retracement levels.
If the market reaches levels such as the 38.2 Fib level or 50 Fibonacci level, traders may expect the trend to continue upward. These areas often become strong support and resistance zones.
Many traders enter positions at these levels and place a stop loss order slightly below them. This method helps control risk while targeting higher profit targets.
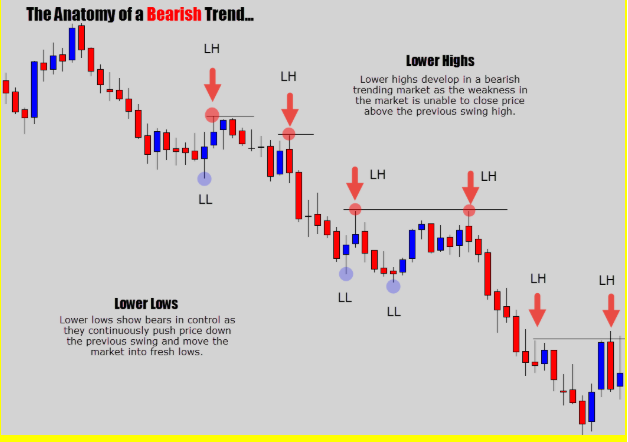
Using Fibonacci in a Downtrend Market
In a bearish trend, the Fib trading strategy works in the opposite direction. Instead of buying pullbacks, traders look for selling opportunities during temporary price increases.
When the market retraces upward to levels like the 38.2 Fibonacci retracement level or 61.8 Fibonacci level, these zones may act as Fibonacci resistance levels. Traders watch these areas closely for signs of weakness.
Once the market confirms a possible trend continuation, traders may open short positions and place their stop loss order above the resistance level.

Fibonacci Retracement Example in Real Trading
A practical Fibonacci retracement example helps traders understand the real application of this technical analysis indicator. Imagine a stock rising from $50 to $100 during a strong bullish trend.
After reaching $100, the price begins a price retracement. A trader applies the indicator between the swing high and swing low to identify potential reaction levels.
| Fibonacci Level | Possible Reaction |
|---|---|
| 23.6 Fibonacci level | Small correction |
| 38.2 Fibonacci retracement level | Healthy pullback |
| 50 Fibonacci level | Strong support |
| 61.8 Fibonacci level | Golden ratio reversal |
| 78.6 Fibonacci level | Deep correction |
If the price reacts strongly near the 61.8 Fibonacci level, traders may enter a position expecting trend continuation.
Combining Fibonacci with Support and Resistance
One of the most effective methods in technical analysis is combining Fib support and resistance with traditional support and resistance zones.
When a Fibonacci retracement level aligns with a strong historical support or resistance area, the level becomes more powerful. Traders often call this “confluence” because multiple signals confirm the same trading strategy confirmation.
For example, if the 61.8 Fib level overlaps with a previous resistance zone in the stock market, traders may expect a strong reaction. This combination improves risk management in trading and increases the probability of successful trades.
Fibonacci Retracement with Moving Averages
Moving averages are widely used trading indicators that smooth price data to reveal the overall trend. When combined with the indicator, they create a powerful technical analysis strategy.
For example, when the 50 Fibonacci level aligns with a 50-day moving average, the area becomes a strong Fibonacci support levels zone. Many traders view this overlap as a strong signal.
This combination helps traders determine precise Fib entry points while improving their market trend analysis and overall risk management in trading.
Fibonacci Retracement with MACD Indicator
The MACD indicator measures momentum and helps identify changes in market trends. When used alongside Fibonacci retracement, it provides powerful trading strategy confirmation.
Suppose price retraces to the 38.2 Fibonacci retracement level during a bullish trend. If the MACD indicator also shows bullish momentum, traders may see this as a strong buying opportunity.
Because this method combines momentum analysis with Fibonacci retracement price levels, it often improves the accuracy of trading chart analysis.
Fibonacci Extensions Explained
While Fibonacci retracement identifies potential pullback zones, extension levels help traders predict future price targets.
Extensions appear beyond the original swing high and swing low and indicate where the next move may reach after a trend continuation. These levels are extremely useful for setting profit targets.
Common extension levels include:
| Extension Level | Purpose |
|---|---|
| 127.2% | Early price target |
| 161.8 Fibonacci extension | Major profit target |
| 261.8% | Strong trend continuation |
| 423.6% | Extreme market movement |

These levels help traders manage trades effectively while maintaining proper risk management in trading.
Fibonacci Extension Levels for Profit Targets
The 161.8 Fibonacci extension is one of the most important targets used in trading strategy. It represents a natural expansion of the golden ratio in financial markets.
After entering a trade during a price retracement, traders often set their take profit level near the 161.8 extension. This helps them lock profits during strong trend continuation.
By combining Fib entry points, stop loss order, and extension levels, traders can build a complete trading strategy.
Best Markets to Use Fibonacci Retracement
The Fib indicator works well in almost all financial markets because price movements often follow natural patterns derived from the Fibonacci sequence. However, it performs best in markets that show clear market trends and strong momentum.
Markets that trend strongly usually create clear swing high and swing low points. These points allow traders to draw an accurate chart and perform effective trading chart analysis.
Because of this behavior, the Fibonacci trading strategy is commonly used in the forex market, stock market, and cryptocurrency trading where large price swings and price retracement movements frequently occur.
Fibonacci Retracement in Cryptocurrency Trading
The cryptocurrency trading market is extremely volatile, which makes analysis very useful. Large price swings create frequent price pullback opportunities that traders can analyze.
For example, when Bitcoin or Ethereum moves rapidly upward, traders apply the indicator to locate potential Fibonacci retracement entry points during the correction phase.
Because crypto markets move quickly, traders often combine price levels with chart patterns and other trading indicators to strengthen their trading strategy confirmation.
Advantages of Using Fibonacci Retracement
One major advantage of its simplicity. Traders only need to identify a swing high and swing low to apply the trading tool and generate important Fib levels.
Another advantage is its flexibility. The Fibonacci retracement trading strategy can work in many financial markets, including the forex market, stock market, and cryptocurrency trading.
Perhaps the biggest benefit is that it helps traders improve risk management in trading. By identifying Fibonacci retracement entry points, traders can place a stop loss order and define clear take profit level targets.
Limitations of Fibonacci Retracement
Although Fib is powerful, it is not perfect. One limitation is that the Fib levels do not always guarantee a trend reversal.
Markets are influenced by many factors such as economic news, political events, and investor sentiment. Because of this, price may sometimes ignore important FIB levels or resistance levels.
For this reason, professional traders rarely rely only on the Fibonacci retracement indicator. Instead, they combine it with other technical analysis indicators, chart patterns, and market trend analysis.
Common Fibonacci Trading Mistakes
Many beginners misuse FIB because they apply it incorrectly during trading chart analysis. One common mistake is selecting the wrong swing high and swing low points.
Another mistake is relying only on Fibonacci retracement levels without confirming signals from other trading indicators. This can lead to poor entry and exit points.
Traders also sometimes ignore risk management in trading. Without a proper stop loss order, even a good Fibonacci retracement strategy for beginners can result in large losses.
Tips to Improve Fibonacci Trading Accuracy
Improving accuracy in fib analysis requires practice and discipline. Traders should always confirm signals with other forms of technical analysis before making decisions.
Combining fib with support and resistance zones, chart patterns, and market trends often produces stronger trading strategy confirmation.
Traders should also focus on proper risk management in trading. Setting a stop loss order and realistic fib profit targets can protect capital while maximizing potential profits.
")
Key Takeaways from Fibonacci Retracement Strategy
The trading strategy remains one of the most effective tools in modern technical analysis. It helps traders understand market trends, locate potential support and resistance zones, and identify possible trend continuation or trend reversal opportunities.
By using the indicator, traders can improve their trading chart analysis and make better decisions in the forex market, stock market, and cryptocurrency trading.
However, successful trading requires combining the indicator analysis with strong risk management in trading, reliable trading indicators, and disciplined strategy execution.
Frequantly Ask Question
Why is 61.8 a golden ratio?
61.8% comes from the Fibonacci sequence where each number divided by the next approaches 0.618. It is called the golden ratio because it appears frequently in nature, art, and financial markets.
What is the Fibonacci series 0 1 1 2 3 5 8 13?
The Fibonacci series is a number pattern where each number equals the sum of the two previous numbers. Traders use this sequence to create Fibonacci retracement levels in trading.
Is Fibonacci retracement a good strategy?
Yes, Fibonacci retracement is widely used in technical analysis to find support, resistance, and possible trend reversals. However, traders usually combine it with other indicators for better accuracy.
What is the Fibonacci trading indicator?
The Fibonacci trading indicator is a tool used on price charts to identify key Fibonacci retracement levels where price may pause, reverse, or continue a trend.
What is the success rate of Fibonacci retracement?
There is no fixed success rate, but many traders find Fibonacci retracement effective when used with strong market trend analysis and proper risk management.
Conclusion
In conclusion, Fibonacci retracement is a powerful technical analysis tool that helps traders understand price behavior in the financial markets. By using the key ratios derived from the Fibonacci sequence, traders can identify potential support and resistance zones, spot possible price reversals, and improve their trading decisions.
Although the Fibonacci retracement indicator is not perfect on its own, it becomes far more effective when combined with other trading tools and proper risk management. When used correctly, it can help traders plan smarter entries, manage losses, and set realistic profit targets while following the overall market trend.
[…] Volatility Indicators – Tools like Bollinger Bands or ATR (Average True Range) help anticipate market swings and adjust trade size accordingly. […]