If you are new to trading or investing, looking at a chart full of red and green bars can feel confusing. However, these bars are not just random colors; they tell a story of the battle between buyers and sellers. Learning how to read candlestick charts is the most important skill you need to master to become a successful trader.
In this comprehensive guide, we will break down everything you need to know about candlestick charts. From understanding what a single candle means to recognizing powerful patterns, this article will turn you from a beginner into a confident chart reader.
If you’ve ever looked at a crypto or forex chart and felt lost, you’re not alone. Those red and green bars are called candlesticks — and they tell the story of the market. Every candle shows who’s in control: buyers or sellers. It also hints at where price might go next.
Price Action
At ExpertJourny, we believe you don’t need fancy tools to trade well. You just need to understand price action — and it all starts with candlesticks.
A Full Beginner’s Guide
To those who are novices in trading or investing, a chart full of red and green bars is confusing to look at. However, these bars are not just random colors, as they tell the story of the battle between buyers and sellers. Learning how to read candlestick charts is the most important skill you need to master in order to be on your way to becoming a successful trader.
In this comprehensive guide, we are going to break down all the things that you should know about candlestick charts. From understanding what a single candle means to recognizing powerful patterns, this article will turn you from a complete beginner into a confident chart reader.
What each part of a candlestick means
Five powerful patterns every beginner should know
How to use them safely in crypto and forex
Common mistakes to avoid
And how to practice without risk
No jargon. No hype. Just clear, practical knowledge — the way we teach in our free training.
What Is a Candlestic
dlestick Chart is a type of financial chart used to visualize the price movements of an asset (like Stocks, Forex, or Crypto).
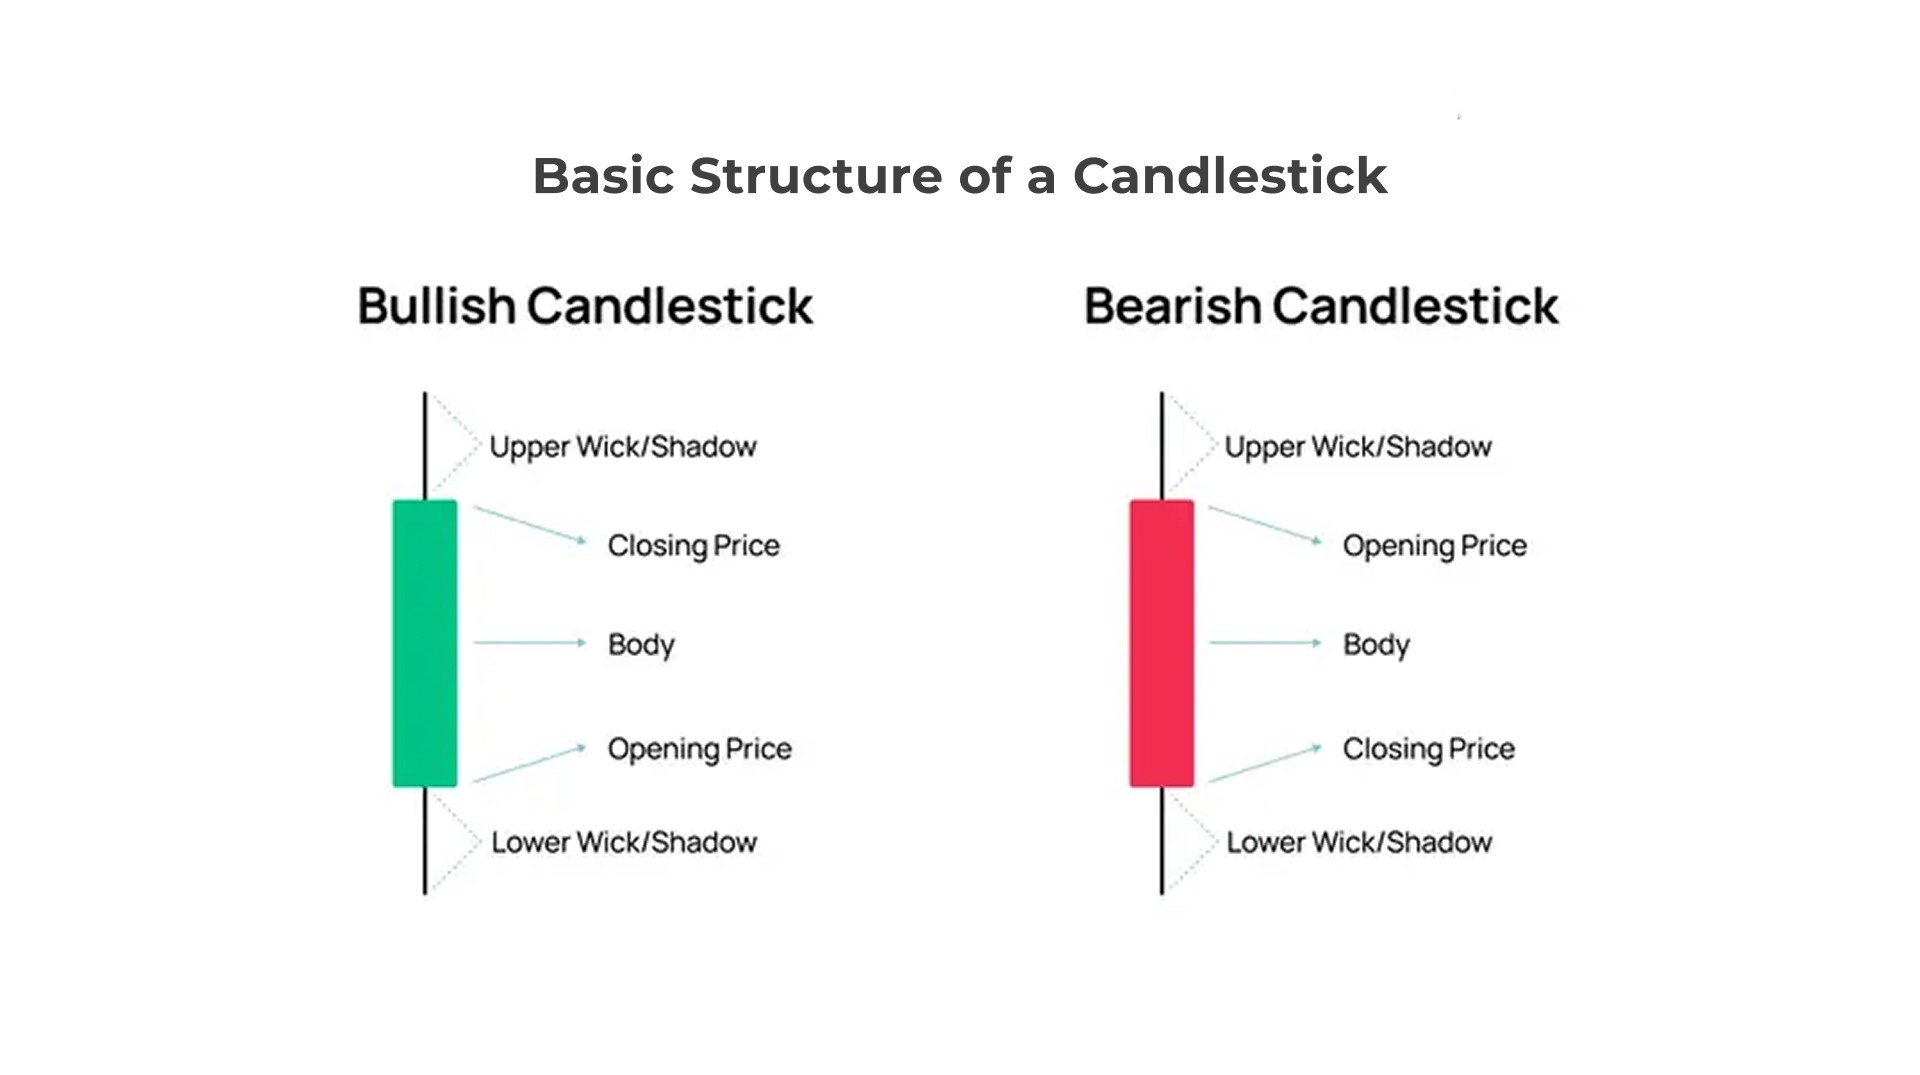
Unlike a simple line chart that only shows the closing price, a candlestick chart shows four key pieces of information:
A candlestick shows price movement over a set time — like 1 hour, 4 hours, or 1 day.
Every candle has four key prices:
Open: Price when the period started
close: Price when the period ended
High: Highest price during the period
Low: Lowest price during the period
The thick part is called the body. It shows the gap between open and close.
The thin lines above and below are wicks. They show the high and low.
Green (or white) candle: Price closed higher than it opened → Buyers won
Red (or black) candle: Price closed lower than it opened →Sellers won
Why does this matter? Because candlesticks reveal market emotion. Long green candles mean strong buying. Long red candles show fear or panic. Small candles mean traders are unsure.
")
The 5 Most Useful Candlestick Patterns
for Beginners
To understand how to read candlestick charts, you first need to understand the anatomy of a single candle. Every candle has two main parts: the Body and the Wick, also known as the Shadow
Body Length: The length of the body provides a representation of the strength behind either buying or selling pressure.
Long Body: Shows strong momentum in buying or selling.
Short Body: This reflects consolidation or weak momentum (nobody is in control).
You don’t need to memorize dozens of patterns. Start with these five. They work in crypto, forex, and stocks — and are easy to
spot.
To understand how to read candlestick charts, you first need to understand the anatomy of a single candle. Every candle has two main parts: the Body and the Wick (also called the Shadow).
Bullish Pin Bar
Also Called a Hammer)
The body is the thick rectangular part of the candle.Body Length: The length of the body provides a representation of the strength behind either buying or selling pressure.
Long Body: Shows strong momentum in buying or selling.
Short Body: This reflects consolidation or weak momentum (nobody is in control).
How it looks: Small body, long lower wick, little or no upper wick
Where it appears: At the bottom of a downtrend or near support
What it means: Sellers pushed price down, but buyers returned strongly → price may rise
How to trade: Buy when price moves above the pin bar’s high. Place stop-loss below the wick
For example: Bitcoin falls to $60,000, forms a hammer, then rises to $65,000.
Bearish Pin Bar
The Colors: Green, Bullish vs. Red, Bearish
While colors can be customized most charts use Green and Red.
Green, or White/Blue Candle: This is a Bullish candle.
It means that the price closed higher than when it opened.
The buyer is in control.
The Open is the bottom of the body, and the Close is the top.
Red or Black Candle: This is a bearish candle.
That means the price closed lower than it opened.
The sellers are in control.
The top of the body is the Open, the bottom is the Close.
How it looks: Small body, long upper wick, little lower wick
Where it appears: At the top of an uptrend or near resistance
What it means: Buyers pushed price up, but sellers took over → price may drop
How to trade: Sell when price moves below the shooting star’s low. Stop-loss goes above the wick
")
Bullish Engulfing
This is when a small red candle is followed by a big green candle, which engulfs the red body completely, thereby giving a strong buy signal.
Bearish Engulfing: A small green candle is followed by a big red candle that covers it. That gives a strong sell signal.
Understanding Timeframes
When learning how to read candlestick charts, you must understand Timeframes.
1-Minute Chart: One candle forms every 1 minute. Used for Scalping/Day Trading. It is VERY fast.
15-minute Chart: A candle is created every 15 minutes.
How it looks: A small red candle, followed by a larger green candle that covers it
Where it appears: After a downtrend
What it means: Buyers overwhelmed sellers in one strong move
How to trade: Enter on the close of the green candle. Stop-loss below the low of both candles
Bearish Engulfing
Have you ever watched a stock or cryptocurrency shoot up all day, only for a single red candle to wipe out all the gains in minutes? That sudden drop is often caused by a powerful signal known as the Bearish Engulfing Pattern.
In the world of technical analysis, learning to identify trend reversals is the key to locking in profits and avoiding crashes. While there are many candlestick patterns, the Bearish Engulfing is one of the most reliable and easy-to-recognize signals that a trend is about to reverse from up to down.
In this comprehensive guide, we will break down exactly what a Bearish Engulfing Pattern is, how it forms, the psychology behind it, and the exact steps you should take to trade it safely.
How it looks: A small green candle, followed by a larger red candle
Where it appears: After an uptrend
What it means: Sellers took full control
How to trade: Enter on the close of the red candle. Stop-loss above the high
Doji The Indecision Candle
How it looks: Very small body (open ≈ close), long wicks on both sides
What it means: Buyers and sellers are balanced → market is unsure
Key tip: A doji near support or resistance often means a bigmove is coming soon
Important: Never trade a doji alone. Wait for the next candle to confirm direction
")
Wait for Confirmation
Don’t jump in too early. Wait for the next candle to close in your favor.
For example: After a bullish pin bar, wait for the next candle to close above the pin bar’s high.
Always Manage Risk
Risk Management in trading is the practice of protecting your capital from significant losses. It is a set of rules that tells you how much money you are willing to lose on a trade and when you will exit if things go wrong.
Think of trading as a business. In any business, there are expenses. If you own a coffee shop, you pay rent, buy beans, and pay staff. These are your costs. In trading, a small loss is the cost of doing business.
A trader who manages risk knows that losses are inevitable. They accept them as part of the game. The goal is not to have no losses; the goal is to make sure that the losses do not destroy your account so you can trade another day.
Use a stop-loss on every trade
Risk no more than 1% of your account per trade
Aim for at least 1:2 reward-to-risk (e.g., 40-pip profit for 20-pip stop)
Common Mistakes to Avoid
Many beginners lose money because of these errors:
Trading every candlestick: Only trade at key levels — not randomly
Ignoring the trend: In an uptrend, look only for bullish setups
Using too many indicators: Candlesticks work best when used alone or with price structure
Trading on very short timeframes: Stick to 1H or higher for cleaner signals
How to Practice Without Risk
Have you ever wanted to try trading stocks, forex, or cryptocurrency but were too afraid to lose your hard-earned money? This is a completely valid fear. The financial markets can be brutal for beginners. In fact, over 90% of new traders lose money in their first year.
However, there is a way to learn the art of trading without risking a single penny. You can learn how to analyze charts, execute strategies, and manage risk—all with zero financial danger.
In this comprehensive guide, we will show you how to practice trading without risk. We will explore the best tools available, how to use them effectively, and the transition you must make when you are ready to trade with real money.
You don’t need real money to learn. Here’s how to practice safely:
Open any chart — like BTC/USD or EUR/USD
Click the “Replay” button (bottom toolbar)
Move back in time and practice spotting patterns
Test your skills for 2–4 weeks before using real funds
At Expert Journy, we use this method in our free training — because practice builds real confidence.
Candlesticks in Crypto vs Forex
Crypto markets are more volatile. That means:
If you are a trader, you already know that candlesticks are the universal language of the market. Whether you are trading Gold, Tesla stocks, Bitcoin, or the Euro, the Green and Red bars look the same. A Hammer is a Hammer, and an Engulfing pattern is an Engulfing pattern.
However, looks can be deceiving.
While the shape of the candlesticks is the same, the behavior behind them is vastly different depending on whether you are trading Forex (Foreign Exchange) or Crypto (Cryptocurrency). If you apply the exact same strategy to both markets without understanding the differences, you will likely blow up your account in one and profit in the other.
In this comprehensive guide, we will break down Candlesticks in Crypto vs Forex. We will explore volatility, reliability of patterns, volume analysis, and how to adjust your trading for each market
Wicks are longer
Fakeouts happen more often
Always wait for the candle to close before trading
Forex markets are calmer. Patterns on 4-hour or daily charts are often more reliable.
But the rules are the same:
FAQ,S
How to read a candlestick chart for beginners?
Learn to identify the body, wicks, and close of a candle. The body shows the opening and closing price, while the wicks show the highest and lowest prices reached.
What is the 3 candlestick rule?
The Three White Soldiers rule suggests that three consecutive long green candles with small wicks usually indicate a strong bullish trend reversal is starting.
How to tell if a candle is bullish or bearish?
If the close price is higher than the open price, the candle is bullish (usually green). If the close price is lower than the open price, the candle is bearish (usually red).
What is a bullish pin bar ?
A bullish pin bar is a candle with a small body at the top and a very long lower wick. It signals that sellers tried to push the price down but buyers overwhelmed them, pushing it back up.
Disclaimer: This content is for educational purposes only and should not be taken as financial advice.